
 Facebook
 X
X
 Pinterest
 Copy Link

This video is the latest in our Monday with Matthew series with Windermere Chief Economist Matthew Gardner. Each month, he analyzes the most up-to-date U.S. housing data to keep you well-informed about what’s going on in the real estate market.
Hello there! I’m Windermere Real Estate’s Chief Economist, Matthew Gardner, and welcome to the latest episode of Mondays with Matthew.
A few weeks ago, one of my viewers on You Tube sent me a note asking when I was expecting mortgage rates to start to rise and, if I believed that they were going to go up, how fast will they rise, and what impacts will higher rates have on home prices.
Well, I would like to thank this particular viewer for the question, and it’s going to be the topic of today’s video.
How Mortgage Rates Are Set
But before we start looking at the future of mortgage rates, I was speaking to some of our interns here at the office a while ago and one of them asked me to explain how mortgage rates are set and – because this is somewhat pertinent to today’s topic – I thought that I’d take just a minute or two to explain to you how this all works.
Of course, there are a lot of factors that impact the rate that a home buyer themselves will get, and they include credit quality, loan-to-value ratios and the like, but the base rate is set not by looking at a home buyer, but at the economy itself and, specifically, the bond market – and even more specifically, the interest rate of 10-year US treasuries.
Now, if you’re asking yourself why 30-year mortgages are based off 10-year bonds and not 30-year? Well, that would be a good question, and this is the answer. You see we move, on average, every 10 years and that’s why!
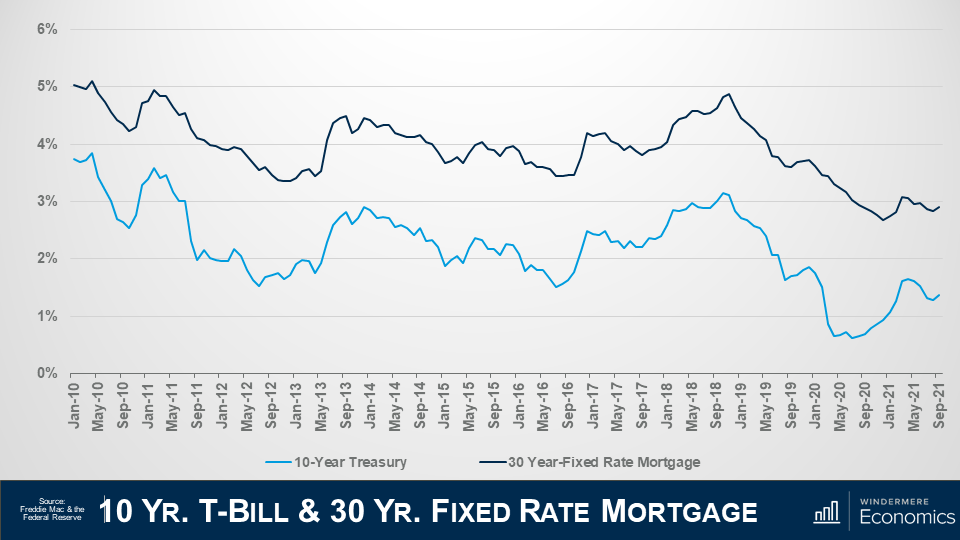
Here is a chart showing the average yield – or interest rate – on 10-year treasury bills by month going back to 2010 in light blue, and the average 30-year mortgage rate in dark blue. I hope that you can see the tight relationship they have to each other.
Of course, there are times when bond yields can go down and mortgage rates rise, and vice-versa but, in general, they track each other pretty closely.
And if you’re wondering why the rates aren’t simply the same, well it’s because a treasury bond has no risk – as its backed by the US government – but there is some risk associated with a mortgage, so buyers of mortgage bonds expect a premium to be added because of this risk, and this has averaged just over 1.5% since the 30-year mortgage came into being back in the early ‘70’s.
Now, there are some people out there who think that the interest rate on 10-year treasuries doesn’t set mortgage rates, rather its better to track the interest paid on mortgage bonds and, although I do see why they might think this, the base mortgage rate is actually set by treasury yields and the interest on mortgage bonds is set using that base and adjusting it to manage the prevailing risk tolerance that investors are prepared to accept so I believe that watching movements in the interest paid on 10-year treasuries is the right way to go.
And that, in essence, is how the 30-year mortgage rate is set.
The History of Mortgage Rates
If you are a regular viewer of these videos you will now that I like to start off with some context to the subject I am addressing and this chart will show the average rate for conforming 30-year fixed rate mortgages going back to their genesis in the early 1970’s.
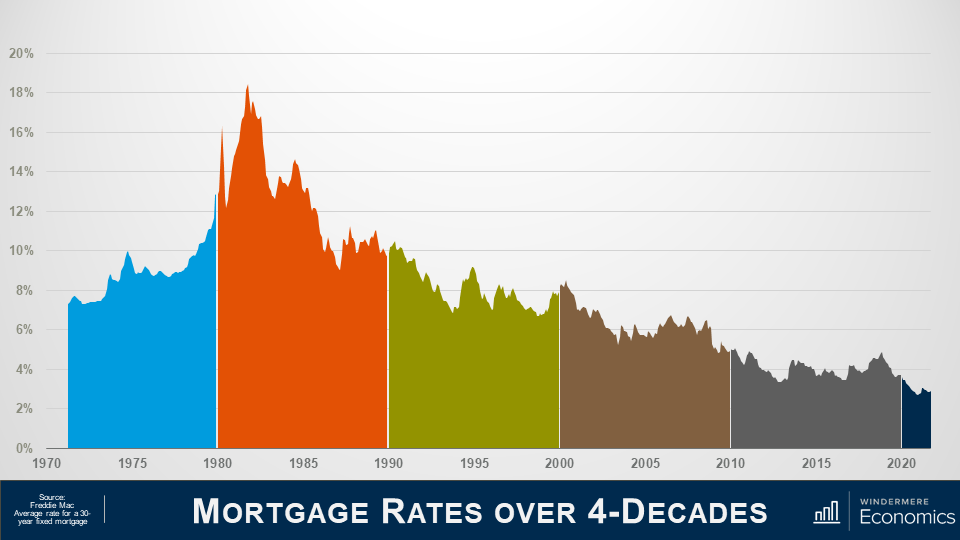
Back in ‘71 rates were in the mid-7% range, rising to just under 10% in ‘74, before pulling back but, as you can clearly see, they started to spiral upward in ’77, ending the decade at almost 13% and if you’re wondering what led to this massive jump, well this was because the country had entered a period of high inflation.
In the ‘70s the country was pushed into a recession basically due to an oil embargo that led to the price of oil quadrupling and that led to a period of so-called stagflation which is when inflation rises, and economic activity slows.
And in the early ‘80’s we entered a period of so-called hyperinflation, as another oil embargo was took hold and the Fed was forced to step in and raised short-term rates which led rates along the yield curve to rise and this – of course – included 10-year treasuries which hit 15.3% in the fall of 1981 and that, as we have discussed, caused mortgage rates to hit an all-time high in October of 1981 at close to 18.5%. Rates then started to pull back and
In the 90’s, rates started to trend lower but jumped again in ’94 as the Fed tightened monetary policy given the significant growth that the country was seeing, but they started to pull back in the second half of the decade, falling to the mid-6’s before notching higher in ’99.
In the 2000’s, rates dropped to 5.3% in 2003 as the housing market boomed but, as we all know, it wasn’t all unicorns & rainbows in this decade of what was then – historically low rates.
The housing crash led the Fed to jump in by cutting interest rates, but they also started a massive purchase of mortgage bonds at very low interest rates as they were happy to take a low return as long as it stabilized the housing market. As a result of their efforts, mortgage rates fell almost a full percentage point, averaging just a hair above 5 % in 2009.
Riding the wave of low bank borrowing costs, mortgage rates entered the new decade around 4.7% and continued to fall steadily, dropping to the mid-3’s by 2012. But in 2013 you can see that rates headed higher. Why? Well, a big part of this has to do with some panic in the bond market, but we will get to that shortly.
Anyway, rates went up in 2014 before dropping to 3.85% in 2015 as the market calmed down.
They rose again after the 2016 presidential election, reaching their peak at the end of 2018 and start of 2019, but still ending the decade below 4%.
As for the current decade, well, it’s all been about COVID-19.
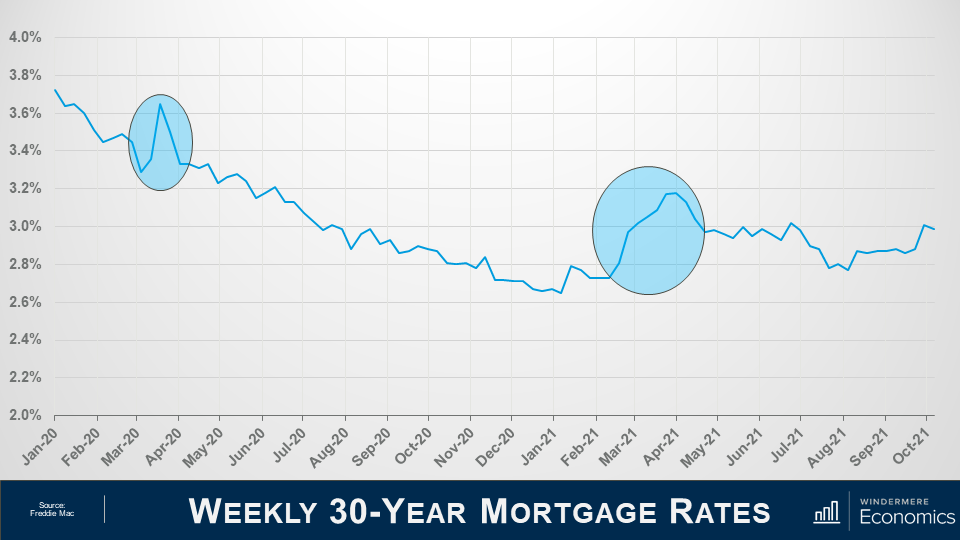
To understand what’s happened over the past couple of years, we need to look at the weekly average rate and I am sure that you have noticed the first spike in the graph.
And it was totally due to the Coronavirus which created an unprecedented situation for all rates (not just mortgages, but US Treasuries and everything else).
You see, investors were panicking during the early stages of the pandemic, not just because the country – essentially – shut down for a brief period, but there were rumors about a thing called forbearance, and investors were panicking that they would not get paid for the mortgage bonds they held, and they did what we all do when we get worried about the economy and, specifically, our investments. They get out of their investment positions and into cash and that’s absolutely what they did, but I should add that I am not talking about them stashing dollars under the mattress. No, they moved into cash positions in financial markets, which are the most liquid, nimble place an investor in the US can be.
And with a lot of institutions and individuals getting out of bonds and not many buyers out there, what happened to rates? That’s right, they rose to attract buyers and rise they did. So much so, in fact, that on a single day in March of 2020, mortgage bonds prices changed 5 times! Quite unprecedented.
Anyway, the Fed reverted to their old playbook and went on a massive bond buying spree with the biggest ever purchase of mortgage-backed securities on Thursday March 19 but, quite remarkably, they announced the very next day that they were going to buy even more. How much more, you ask… Well, they decided to buy three times more than the record purchase they made just the day before!
And because of this, rates dropped dramatically and continued to pretty much head lower for the rest of the year and into early 2021.
But then the music stopped, as you can see in the second highlighted spike in the above graph.
You see, a special election was being held in Georgia and the bond market decided to take a conservative stance prior to the election and that led rates higher again. But the election wasn’t the only reason why rates rose.
You see, COVID 19 cases that were dropping, improved vaccine distribution appeared to be in place, there were several stronger than expected economic reports released, and progress on a fiscal stimulus package. All of these factors led rates higher because, as you know, when economic news is positive, that is actually bad for bond yields as people move back into equities and out of bonds which is obviously bad for mortgage rates as bonds need to offer a higher interest rate to attract the few buyers that were out there.
Mortgage Rate Forecast
So that’s where we are today, but what of the future?
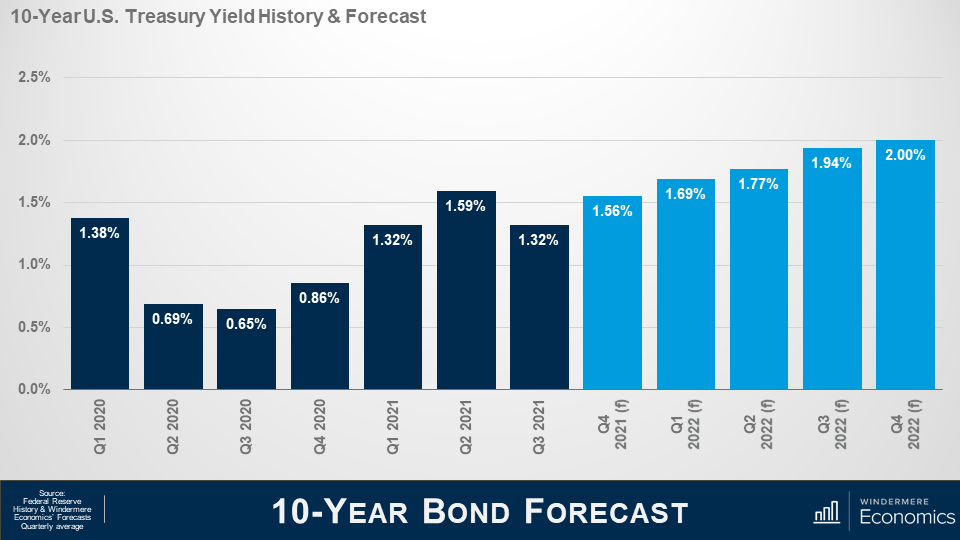
Here is my forecast for 10-Year treasuries through the end of next year and you will see that I am looking for rates to rise gradually as we move into next year and this will lead mortgage rates to start notching higher as well.
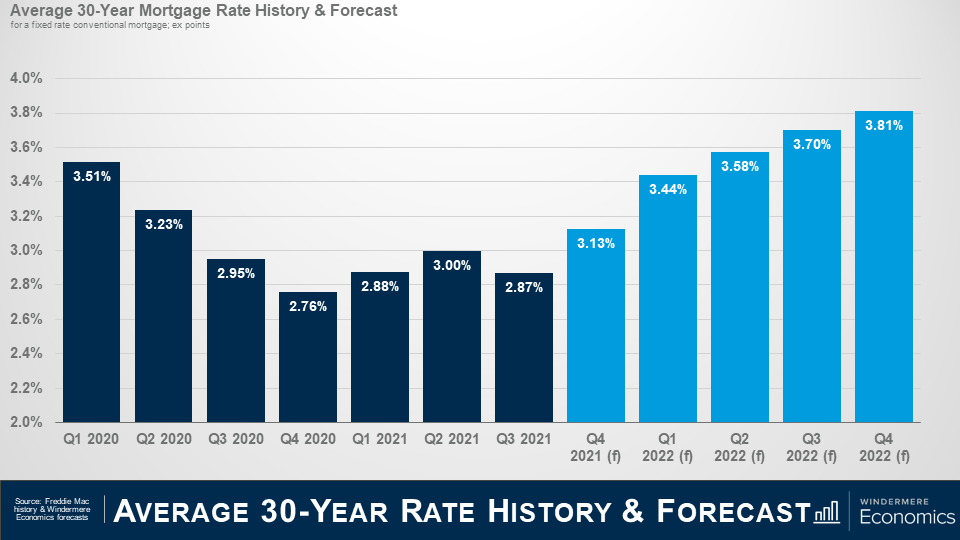
And here is my forecast for mortgage rates. Although they should move higher, I am still not seeing rates break above 4% until 2023 at the earliest and – even as they start to increase – I really don’t see it as a major deterrent to home buyers.
But before you start to say that this is only one person’s forecast and it could be wrong, lets look at my forecast compared to some of my industry colleagues.
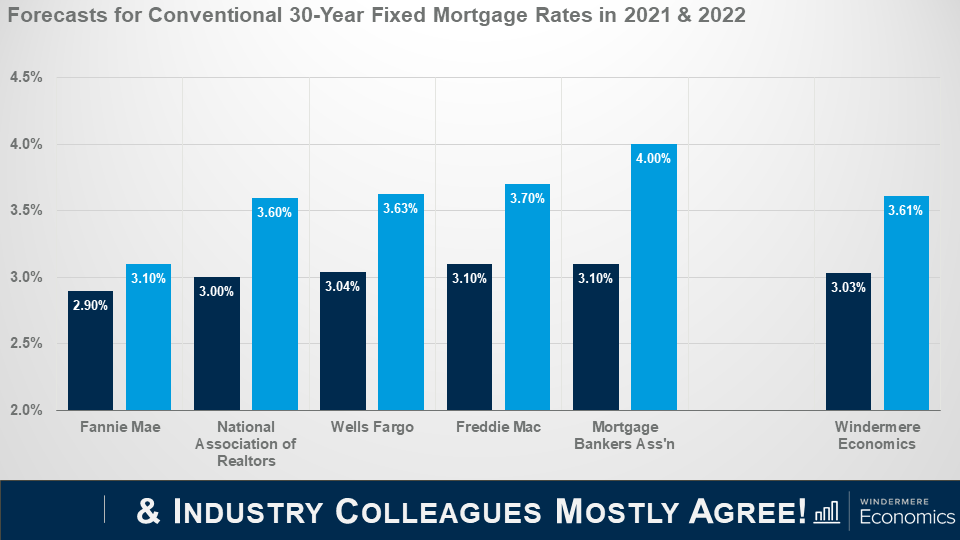
As you can see, we are all in a pretty tight range when it comes to forecasting the average rate this year and next.
The bottom line is that although rates will rise, they will remain very competitive when compared to historic averages and the upward trend in rates is unlikely to have any significant impact on prices. That said, many markets are already having an affordability crisis and rising rates will certainly act as an additional headwind to price growth; however, it would take a significantly greater increase in rates to negatively impact prices.
Well, I hope that you have found this month’s discussion to be interesting. As always if you have any questions or comments about this topic, please do reach out to me but, in the meantime, stay safe out there and I look forward the visiting with you all again, next month.


