Market News • Matthew Gardner • June 28, 2022

The Growing Housing Affordability Problem


This video is the latest in our Monday with Matthew series with Windermere Chief Economist Matthew Gardner. Each month, he analyzes the most up-to-date U.S. housing data to keep you well-informed about what’s going on in the real estate market. 


Hello there, I’m Windermere’s Chief Economist Matthew Gardner and welcome to this month’s episode of Monday with Matthew.

If you’ve listened to me at all over the past several years, you’ll know that I am pretty passionate about one subject: housing affordability. And, given the significant price growth that we’ve seen over the past decade, as well as the recent spike in mortgage rates, I wanted to talk a little bit about what might be done to address this very serious issue.

The Growing Housing Affordability Problem

Now, when we think about housing affordability and how it might be solved, a lot of people get tied up in the minutiae when, quite frankly, it really isn’t that hard a problem to solve. You see, there’s one very simple way to address this: to build more housing units. But, as easy as that may sound, there are a lot of obstacles that are holding new supply back. But before I get to that, I want to share some data with you that might help to demonstrate how serious an issue we all face.

Every quarter, the National Association of Homebuilders puts out its affordability numbers for metro areas across the country. An analysis of sales and incomes allows them to show the number of homes—both new and existing—sold in a quarter that were affordable to households making median income.

Housing is Increasingly Unaffordable

Here you will see numbers from just a few of the 240 metropolitan areas across the country and the share of sales in the first quarter of this year that were “technically” affordable. I think you’ll agree that it’s eye opening.

A map of the United States showing the percentage of homes sold last quarter that were affordable to households making median income in select markets. 32.5% of new and existing homes sold in Seattle were affordable to household making median income, 40.1% in Tacoma, Washington, 43.2% in Portland, Oregon, 41.7% in Eugene, Oregon, 14.4% in San Francisco. 21.9% in San Jose, California, 8.3% in Los Angeles, 14.6% in San Diego, 41.4% in Las Vegas, 25.4% in Bend, Oregon, 25.7% in Boise, and 22.3% in the New York/Jersey City area.


Although I am only showing you a few of the U.S. markets I will tell you that the ten least affordable US housing markets were all in California. The Golden State is also home to 21 of the top 25 least affordable markets in the country. But what you might also find interesting is that our primary cities aren’t the only ones that are suffering from affordability issues, with markets like Bend, Oregon; Boise, Idaho; and even Las Vegas, Nevada becoming increasingly unaffordable for a lot of households.

And it’s worth mentioning that that 48 of the 69 markets where less than half of the homes sold were affordable were in states that have at some point in the past implemented comprehensive planning and growth management legislation. And when governments mandate where homes can and cannot be built, one thing happens: it pushes land prices higher which makes new homes more expensive and limits the amount of new supply that builders are able to provide. So, what can be done?

Well, I will start out by saying that states who have implemented growth management plans, which they generally did to slow or stop suburban sprawl, remain disinclined to move these boundaries, and that means it becomes paramount to not look further out but to concentrate within the urban growth boundaries and decide whether it’s time to think about removing single-family zoning altogether.

This is a fascinating thought, but I must add that I am not suggesting that we do away with single-family homes. Absolutely not! What I am thinking about is the ability for a market to decide what makes the most sense. In order to do so, single-family zones need to allow for the development of denser housing, but also allow the market to decide what’s best. Areas that have implemented such change has given rise to a movement in order to address what is being referred to as “missing middle housing.” For those of you who are unfamiliar with this term let me try and explain.

Missing Middle Housing

A depiction of different housing types from Optico Design Inc. that illuminates the "missing middle" housing types that were common prior to World War II but are now far less common and, therefore, "missing". The housing types in the "missing middle" include duplexes, fourplexes, courtyard buildings, cottage corts, townhouses, medium-sized multiplexers, stacked triplexes, and live-work buildings. The housing types outside of the "missing middle" include detached single-family houses and mid-rise apartment buildings.


This is a great image courtesy of Opticos, a team of urban designers, architects, and strategists who are passionate about adding sorely needed housing options.

They came up with the term “missing middle” as it describes housing types that were actually very common prior to World War II where duplexes, row-homes, and courtyard apartments were in high demand. Unfortunately, however, they are now far less common and, therefore, “missing.”

And the key function of this type of housing is to meet the rising demand for walkable neighborhoods, respond to changing demographics, and provide housing at different price points. You see, rather than focusing on the number of units in a structure—think high rise apartments or condominiums—this type of housing emphasizes scale and heights that are appropriate for and sympathetic to single-family or transitional neighborhoods.

The Decline of Missing Middle Housing Construction

A bar chart showing the number of duplexes to 8-unit buildings built over roughly the past half-century dating back to 1974. The years 1974 through 2021 appear on the x-axis and the number of completed units built appears in thousands on the y-axis, ranging from 0 to 300. On the z-axis, the chart shows what percentage of total new homes completed the y-axis values for that year accounted for. The z-axis ranges from 0% to 18%. The highest values in the chart are 1974 and 1984, when roughly 250,000 units were completed, which was roughly 15% of the total new homes completed that year. The chart gradually declines from the mid-1980s to present day. Since 2007, there hasn't been a single year where over 50,000 units were completed.


And to show you how supply of these types of units has changed, this chart shows the number of duplexes to eight-unit buildings built over the past almost half-century and you can clearly see that up until the late 1980s they were being built in decent numbers, but the 1990s saw a significant shift toward traditional single-family home ownership and builders followed the demand and this type of product started to become scarcer.

Almost 16% of total new homes built in America in the early 1980s were of this style, but that number has now shrunk to just 1.4%—or a paltry 19,000 units.

But I see demand for these housing types growing as we move forward and that buyers or renters, young and old, will be attracted as it will meet their requirements not only in regards to the type of home they would want to live in but, more importantly, it can be built cheaper than traditional single-family housing and therefore it will be more affordable.

But although this sounds like it’s a remarkably simple solution that can solve all our woes, in reality it’s not that easy for two very specific reasons. The first is that many markets are already essentially built out, meaning that in order to develop this type of product, a builder would have to purchase a number of existing homes and raze them in order to rebuild. But given current home values, it’s very hard for a builder to be able to make such a proposal financially.

And the second issue is that current residents within these “transition” areas—which have been developed as traditional single-family neighborhood—simply don’t want to see change. But is this type of product bad? Here are some examples.

This shows row-homes in Brooklyn on the left and traditional “triple-deckers” in Massachusetts on the right:
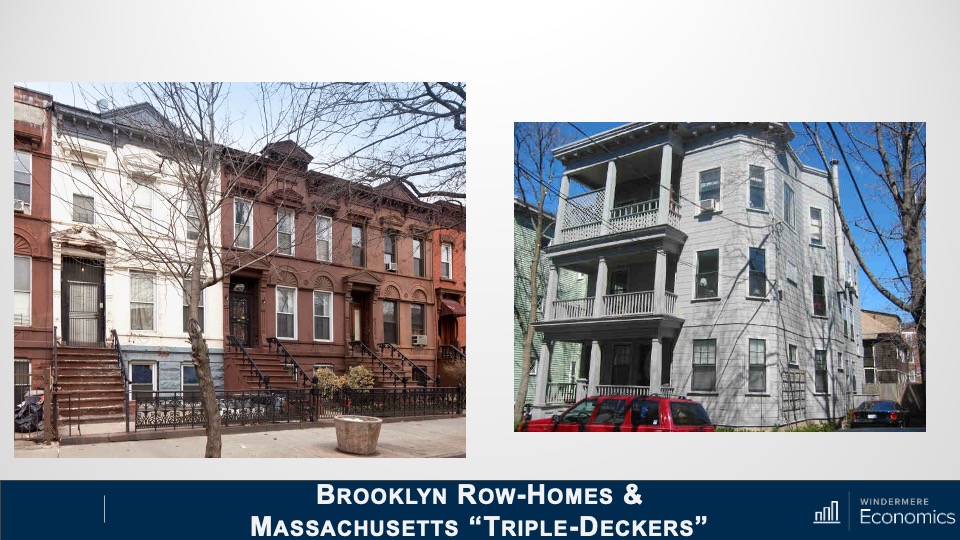
A side-by-side look at two different types of East Coast building types: the horizontal Brooklyn Row-Homes and the more vertically constructed Massachusetts "Triple Deckers."


This is a bungalow court project in California:


An interconnected building of California "Bungalow Courts" with low-pitched roofs and small porches, all connected by a winding sidewalk.


Here are some Live/Work Units in Colorado:


A white live/work unit in Buena Vista, Colorado with a second-story patio built onto the right side of the building.


These are some amazing mews homes in Utah:
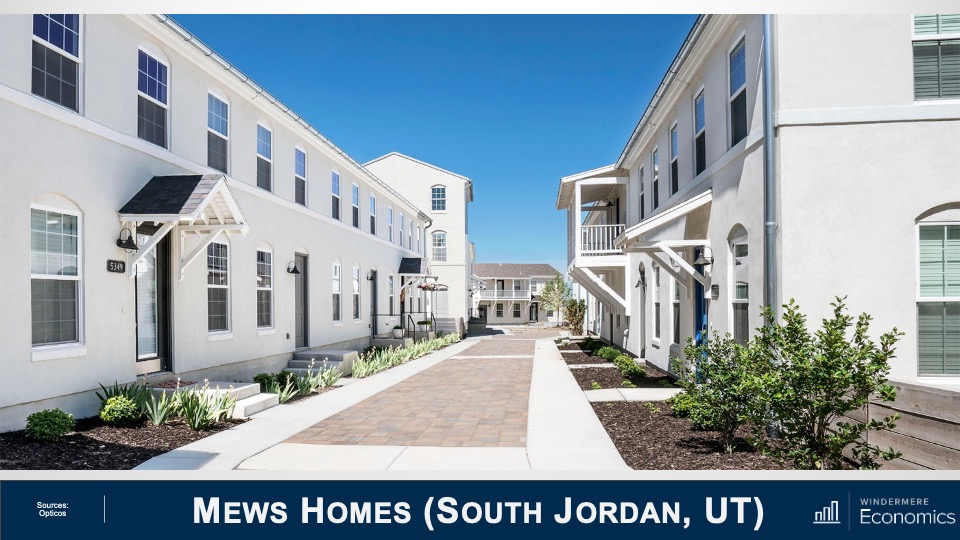
 

A community of Mews Homes in South Jordan, Utah painted white with arched windows and small eaves hanging above the doorsteps.


And finally, a new terrace housing project that will be built in Washington DC:
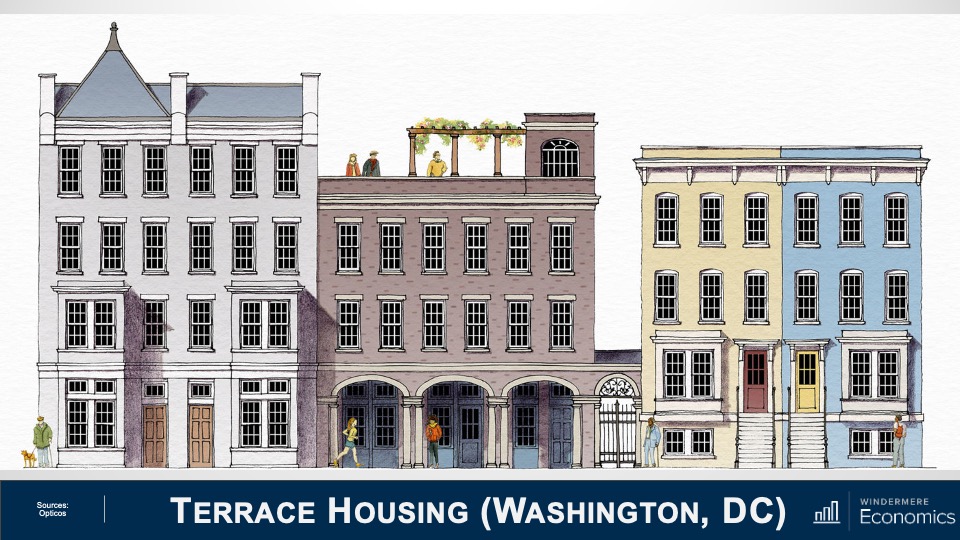
 

A drawing of Terrace Housing in Washington DC showing facades with many windows lined side-by-side on a city street.


Don’t get me wrong, I’m sure that some of you who simply aren’t inspired by this type of architecture, and that is understandable. But can we simply stick with the status-quo? I don’t think so. And some state legislators have already implemented significant zoning amendments in order to try and encourage this type of development.

Back in 2018, Minneapolis was the first city to allow this type of development inside single-family zoned areas. This was followed by Oregon State in 2019. Senate Bill 9 was signed by Governor Newsom of California last year which made it legal for property owners to subdivide lots into two parcels and turn single-family homes into duplexes, effectively legalizing fourplexes on land previously reserved for single-family homes. So, we are starting to see some change.

This is a good start but as I mentioned earlier in areas that are already built out, even this type of forward-thinking legislation will not be the panacea that some want. But I’m not giving up hope.

Addressing the “missing middle housing” would allow for homes of all shapes and sizes, for people of all incomes including workers who are essential to our economy and community. Here I am talking about our teachers, firefighters, administrative assistants, childcare providers, and nurses—just to name a few!

There are currently 45 million Americans aged between 25 and 34 and most aspire to homeownership. However, the massive price growth which, by the way, many of us have benefitted from over the past several years, has simply put a “starter home” out of their reach.

I will leave you with one last statistic. Over 28% of American households today are made up of a single people living alone, and it is anticipated that up to 85% of all U.S. households will not include children by the year 2025. Finally, by 2030, one in five Americans will be over the age of 65.

Are we going to meet the needs of the country’s changing demographic going forward? I certainly hope so, but it will take a lot of work for us to get there. As always, if you have any questions or comments about this particular topic, please do reach out to me but, in the meantime, stay safe out there and I look forward to visiting with you all again next month.

Windermere Community • June 21, 2022

Advancing DEI: Windermere’s Continued Commitment to Change


Written by: Samantha Enos – Vice President of Diversity, Equity, and Inclusion, Windermere Real Estate


Since our company committed to affecting change with regards to diversity, equity, and inclusion (DEI) nearly two years ago, we’ve established several initiatives that have helped us move the needle toward making Windermere a more diverse organization and homeownership more equitable. Guided by our four DEI pillars—community, home ownership, leadership, and culture—we remain focused on finding paths to address discrimination, racism, and inequity within the real estate industry.

Some of our DEI efforts over the past two years:

  • Hired a VP of DEI who is charged with advancing Windermere’s DEI efforts, as well as supporting Windermere offices with their DEI strategies, planning, and programs
  • Developed a committee of Windermere agents, staff, and owners to discuss Windermere’s efforts and to provide input on the direction of our DEI strategies
  • Conducted ongoing DEI training for the Windermere leadership team, as well as for franchise owners and managers
  • Engaged with state and local REALTOR® associations to audit our developing DEI training and educational opportunities offered to agents through our Professional Development department
  • Produced instructional documents to educate homeowners on the history of racially restrictive language in property deeds and how to strike/remove such language from their chain of title
  • Launched a “Race + Real Estate” playlist on the Windermere Spotify channel that offers a selection of podcasts that explore how members of marginalized communities have historically been denied access to homeownership

Sam Smith “Hi Neighbor” Homeownership Fund

Launched in early 2022 through our partnership with non-profit lender HomeSight, the Sam Smith “Hi Neighbor” Homeownership Fund is designed to help low-to-moderate-income home buyers who have been historically underserved by traditional lenders. Through donations from the Windermere Foundation, U.S. Bank, and JP Morgan Chase, the Sam Smith fund is helping to reduce barriers to homeownership by funding loan products for Black/African American first-time home buyers in Washington State.

We have formed a Board of Directors made up of six agents to help manage the program and drive fundraising. As of May 2022, the Sam Smith fund has raised over $127,000 for first-time home buyers, including a personal donation of $50,000 from the Jacobi family to help seed the fund, with over $58,000 raised this year alone. We are actively seeking partnerships with down payment assistance programs in other states to expand our efforts.

Aspire Internship

Formed in partnership with the University of Washington College of Built Environments in July 2021, the inaugural Aspire Internship program produced eight interns, all of whom completed the program and received a $5,000 scholarship. We’ve already seen real-world impact stemming from Aspire, with one of the group project proposals contributing to the creation of an agent scholarship program (see WIN below), and in the hiring of an Aspire alumnus at a Windermere office in Seattle. The program is expanding in summer 2022, with nearly double the number of students participating.

WIN Scholarship Program 

The WIN Scholarship Program was created after recognizing the need to build and support a diverse community of new agents. The program provides up to $2,500 for qualified new hires to be used for training, educational purposes, and relieving the financial burden of the startup costs involved with becoming a real estate agent. The program has made an impact outside of Windermere, as well. Using the WIN Scholarship as a model, Washington REALTORS® has established a pilot program in which they will sponsor one year of REALTOR® member dues, six months’ worth of MLS fees, and $400 worth of training for qualified BIPOC (Black, Indigenous, People of Color) agents.

DEI Resources

For more information on our commitment to diversity, equity, and inclusion, updates on our company initiatives, and further resources on the history of housing discrimination and its impact on our communities, visit windermere.com/dei.

Design • June 6, 2022

5 Ways to Incorporate Nature into Your Home

Home décor often focuses heavily on the latest and greatest trends. But even the most well decorated home can feel like it’s missing a natural element. Here are five simple ways you can incorporate nature into your home to make it feel more connected to the environment it inhabits.

5 Ways to Incorporate Nature into Your Home

1. Natural Light

Natural light has the power to breathe new life into your home. Place your furniture in your living room and/or dining room to make your get-togethers feel more connected to the outdoors and orient your workspace in your home office near a window to stay productive throughout the workday. By finding ways to let the sunshine in, your home will feel refreshed and lighter. Fortunately, this doesn’t require a heavy investment. Try sheer curtains or new blinds wherever your home’s large windows are. This will help to balance the light in the larger spaces around your home, so you don’t have to rely on artificial light sources.


A living room with the sun pouring in through the windows.

Image Source: Getty Images – Image Credit: TomMerton


2. Hardwood Floors / Wood Accents

To truly feel a connection to nature throughout your home, you’ve got to work from the ground up. Making the switch to hardwood floors will significantly impact the look and feel of your home, given the large surface area of such a project. A job of this scale is likely to require the help of a professional, and you may have to find a temporary housing solution while the remodel is being carried out. But you don’t have to go to great lengths to incorporate wood into your home.

Wood accents can deliver much of the same feeling. Experiment with different combinations of driftwood, bamboo, sculptures, and signage throughout various rooms to keep your home thematically consistent.


A living room with hardwood floors and various wood accents.

Image Source: Getty Images – Image Credit: Scovad


3. Organic Materials

Materials like stone, marble, and fabrics will not only help to incorporate nature into your home but will make it feel relaxing and cozy as well. A small collection of rocks or stone pebbles with trickling water in the bathroom work every time to evoke a natural tranquility. Stone or marble tile designs and/or backsplashes help to ground a space by providing an earthy foundation. Natural fibers like wool, cotton, and linen can be sprinkled throughout a home to deliver warmth and comfort while reinforcing a natural theme.


A modern bathroom with a marble backsplash.

Image Source: Getty Images – Image Credit: LumiNola


4. Decorating with Houseplants

Sometimes you don’t have to replicate nature to make your home feel more natural. You’ll be amazed at how refreshed the spaces feel by decorating with houseplants. However, there are certain rules you’ll want to follow when creating your own personal indoor ecosystem. Research the needs of each plant variety you’re interested in buying before making your final purchases. This will allow you to orient them appropriately throughout your home based on their sunlight needs. Plants that can survive with less sunlight are well suited for the darker corners of your home. If you’re not home often to tend to your plants, consider low maintenance varieties like succulents. Houseplants will add color to your home and improve the air quality while they’re at it.


A man sprays water on the leaves of his houseplants.

Image Source: Getty Images – Image Credit: svetikd


5. Decorate with Earth Tones

All the aforementioned ways of incorporating nature into your home—natural light, wood accents, organic materials, houseplants—have a signature color palette. Once you’ve decided how these categories can fit into your home, you can decorate around them with complimentary colors.

Fortunately, you won’t be limited for choice. Earth tones run from darker, rich colors like brown and rust to lighter, vibrant colors like light green and sunlight yellow. The use of these colors can be carried out in your remaining accent pieces, such as towels, carpets, pillows, and more.


A living room decorated with earth tones.

Image Source: Getty Images – Image Credit: CreativaStudio

Market News • Matthew Gardner • May 23, 2022

Moving Patterns for U.S. Homeowners and Renters in 2021


This video is the latest in our Monday with Matthew series with Windermere Chief Economist Matthew Gardner. Each month, he analyzes the most up-to-date U.S. housing data to keep you well-informed about what’s going on in the real estate market. 


Hello there. I’m Windermere Real Estate’s Chief Economist Matthew Gardner and welcome to the latest episode of Monday with Matthew. Over the past few months, analysts like myself have been starting to get our hands on early numbers from the Census Bureau and, although we won’t get the bulk of the data for another several months, I thought it would be interesting to take a quick look at some of the information that the government has put out specifically as it relates to patterns.

This is a relevant topic given the pandemic, with many people wondering if we saw a mass shift in where we choose to live because of COVID-19. This belief that we packed up and moved because of the pandemic is, at face value, quite credible, especially given that home sales in 2021 were at levels we haven’t seen since 2006. But the reality, at least from the data we have received so far, actually tells a different story.

Moving Patterns for U.S. Homeowners and Renters in 2021

We Move More Infrequently

A graph showing the geographic mobility of both non-movers and movers in the U.S. from the years 2000 - 2001. The chart shows that 91.6 didn't make a move in 2021, versus 83.9% in 2000.


This first chart looks at people and not households and it shows that, contrary to popular belief,  we’re actually moving less frequently now then we have done in decades, with the share of people not moving in a single year rising from just about 84% to over 91½%. Of course, we are having fewer children now than we did, but not to the degree that would change the trend.

Unsurprisingly, Renters Move More Often than Owners

Two charts showing that on average, renters move more often than owners in the span of years between 2000 and 2021. Over this stretch of time, the percentage of renters staying put rose from 67.5% to 84%, while homeowners staying put rose from 90.9% to 95.1%.


And when we break this down between homeowners and renters there is quite the discrepancy between the two groups. Although the number of renters not moving has risen from 67½ percent up to 84% since 2000, the number of homeowners staying put has moved from almost 91% all the way up to 95% last year.

So, the data thus far is not suggesting that we saw any form of mass exodus following the pandemic, in fact we haven’t been moving as much for the past 2-decades, but people did move since COVID-19 hit and the reasons they did were fascinating. The following charts are broken up into four categories of movers: those who moved for family reasons; those who moved for employment related reasons; those that moved for housing related reasons; and finally, those that moved for other reasons.

Reasons to Move (1)

A chart showing the reasons why owners and renters moved. Moving due to a change in marital status was virtually the same, while more renters moved for things like getting a new job and moving closer to work. More owners moved due to retirement and because they lost their job.


So, starting with family-related reasons, it was not surprising to see the major reason for both owners and renters to move was to establish a new household, nor was it surprising to see a greater share of renters headed out on their own than homeowners. Finally, the share of those moving because of a change in marital status was essentially the same between renters and homeowners. And when we look at employment related reasons for people moving last year, a greater share of renters moved because of a new job than homeowners, and more renters moved to be closer to their workplaces than did homeowners. Again, not really surprising, given that a large share of renters work in service-based industries and therefore proximity to their workplaces is important. You will also see that a greater share of homeowners than renters moved because they lost their jobs and, finally—and not at all surprisingly—far more homeowners moved because they chose to retire than renters.

Reasons to Move (2)

A graph showing the housing-related reasons to move for both owners and renters. Noticeable differences include that more renters moved to find cheaper housing and to attend or leave college, while more owners moved for change of climate and health reasons.


And when we look at housing related reasons that people moved, a large share of owners and renters moved from their current home or apartment and into a new, bigger, better house or apartment. A statistically significant share looked to move into a better neighborhood, and I do wonder whether owners were doing this because of the ability to work from home and possibly move to a better location further away from their workplaces. And even though renters tend to stay closer to their workplaces, I wonder whether these renters weren’t in white-collar industries and that the ability to work from home has led them to move into an area that they perceive to be better suited to them.

And finally, a significant share of renters moved because of the fact that rents have been skyrocketing over the past 18-months or so. This clearly impacted some homeowners, too. And finally, under the “other” category, more renters than owners moved because they were either entering or exiting a relationship with a domestic partner, and more renters left to either go to college or because they had completed their degrees.

Health-related reasons for moving had a significant impact on homeowners over renters, and I found it particularly interesting to see a lot of owners saying that “climate” was a reason for their move. Of course, I can only hypothesize as to whether people are simply looking to move to warmer climates or whether climate change is starting to have an increasingly large influence on where we choose to live. My gut tells me that climate change is becoming a far more important consideration for homeowners, although we can’t deny that a lot of people, specifically on the East Coast, moved South during the pandemic.

These next few charts break down movers not just by whether they our owners or renters but also by ethnicity.

2021 Mobility by Ethnicity & Tenure: Owners vs Renters Movers and Non-Movers

Six pie charts showing the non-moving and moving percentages for 2021 among populations of White, Black, and Asian owners (95.1%, 95.6%, and 95.7% respectively for non-movers and 4.9%, 4.4%, and 4.3% respectively for movers) and White, Black, and Asian renters (83.7%, 85.3%, and 84.9% for non-movers respectively, and 16.3%, 14.7%, and 15.1% for movers respectively.)


Here you can see that homeowners across these three ethnicities were pretty much uniform in their desire to stay in their existing home with only 4 to 5% moving. And renters who, as we have already seen, did move more frequently last year than homeowners, were also in a very tight range at between 83 and 85%.

2021 Mobility by Ethnicity & Tenure: Owners vs Renters Movers and Non-Movers (2)

Six pie charts showing the non-moving and moving percentages for 2021 among populations of Hispanic, Mixed (White & Other), and Mixed (Black & Other) owners (94.8%, 95%, and 94.9% respectively for non-movers and 5.2%, 5%, and 5.1% respectively for movers) and Hispanic, Mixed (White & Other), and Mixed (Black & Other) renters (87.7%, 83.6%, and 85.2% for non-movers respectively, and 12.3%, 16.4%, and 14.8% for movers respectively.)


And the same can be said about Hispanic owners and mixed race families, with about 95% not moving last year. Now this is modestly lower than White, Black, or Asian households, but the difference is very marginal. As for renters, between 83 and almost 88% of them within these three ethnicities moved last year, but you will see a bigger share of Hispanic renters stayed put as opposed to all the other ethnicities shown here.

2021 Mobility by Ethnicity & Tenure: Moves In & Out of State

Six pie charts showing the percentages of staying in state vs moving out of state for 2021 among populations of White, Black, and Asian owners (82.1%, 81.8%, and 75.2% respectively for those who stayed in state and 17.9%, 18.2%, and 24.8% respectively for out-of-state movers) and White, Black, and Asian renters (82.6%, 81.4%, and 74.1% for those who stayed in state respectively, and 17.4%, 18.6%, and 25.9% for out-of-state movers respectively.)


Looking closer now at those who did move, even though fewer Asian households moved when compared to all other ethnicities, far more left the state than stayed, and the same was true for Asian renters with over a quarter moving out of state.

2021 Mobility by Ethnicity & Tenure: Moves In & Out of State (2)

Six pie charts showing the percentages of staying in state vs moving out of state for 2021 among populations of Hispanic, Mixed (White & Other), and Mixed (Black & Other) owners (86.6%, 81.9%, and 80.9% respectively for those who stayed in state and 13.4%, 18.1%, and 19.1% respectively for out-of-state movers) and Hispanic, Mixed (White & Other), and Mixed (Black & Other) renters (83.6%, 82.4%, and 81.1% for those who stayed in state respectively, and 16.4%, 17.6%, and 18.9% for out-of-state movers respectively.)


Again, a greater share of the Hispanic homeowners who did move last year stayed in the state where their old house was, and the share of mixed households was roughly at the average for all ethnicities. And the share of Hispanic and mixed-race renters who stayed in State was also about average.

What I see from the data is that the huge shift that many expected during COVID has not been affirmed—at least not by the numbers we have looked at. That said, we are sure to see numerous revisions because of the issues that COVID 19 has posed on Census takers, so we may get a different story as more data is released and revisions posted. What I found to be most interesting in the numbers we have looked at was the massive increase in renters moving in with their “significant others.” But I am not surprised, given that there are around 48½ million people aged between 20 and 30, and this is their time!

And I was also interested in the share of the population who moved due to climate. I will be doing some more digging around in the darkest recesses of the Census Bureau website to see if I can find out more about this. Although I can’t confirm it, my gut tells me that climate—and specifically climate change—will be a factor of growing importance when people are thinking about where they want to live.

Living • May 23, 2022

Tips For Emergency Preparedness

With homeownership comes the responsibility of having to plan ahead for life’s unknowns. Emergencies come in many forms, depending on your local climate. So whether its more likely that you and your household need to prepare for the potential of a wildfire, a flood, or a winter storm, it’s crucial to have resources on hand to limit the damage to your home and to protect your household.

Tips for Emergency Preparedness

A good place to start when putting together your emergency kit is to compile basic resources you and your household will need to support yourselves outside of your home. Keep all items together in an easily accessible location. The general rule is to have at least one gallon of water per person, per day. This is useful for drinking, food preparation, and general hygiene. The Red Cross suggests keeping a two week’s supply of water at your home and three days worth in the case of evacuation. The following information is based on the American Red Cross’s emergency preparedness website.

What to include in your home emergency kit

  • A two-week supply of non-perishable food that is easy to prepare
  • Flashlight and extra batteries
  • Battery-powered or hand-crank radio
  • 2 absorbent compress dressings (5 x 9 inches)
  • 25 adhesive bandages (assorted sizes)
  • 1 adhesive cloth tape (10 yards x 1 inch)
  • 5 antibiotic ointment packets (approximately 1 gram)
  • 5 antiseptic wipe packets
  • 2 packets of aspirin (81 mg each)
  • 1 blanket (space blanket)
  • 1 breathing barrier (with one-way valve)
  • 1 instant cold compress
  • 2 pair of non-latex gloves
  • 2 hydrocortisone ointment packets (approximately 1 gram each)
  • Scissors
  • 1 roller bandage (3 inches wide)
  • 1 roller bandage (4 inches wide)
  • 5 sterile gauze pads (3 x 3 inches)
  • 5 sterile gauze pads (4 x 4 inches)
  • Oral thermometer (non-mercury/non-glass)
  • 2 triangular bandages
  • Tweezers
  • First aid instruction booklet

To-Go Bag

Keep a to-go bag on hand to ensure that you and your household have easy access to essential items such as medication, toiletries, chargers, cash, and more.

  • If you or family members have medications, make sure you have at least a seven day supply
  • Multi-purpose tool (Swiss army knife)
  • Sanitation and personal hygiene items
  • Hand sanitizer
  • Toothbrushes and toothpaste
  • Personal wipes

Personal documents

  • Copies of personal documents (medication list and pertinent medical information, proof of address, deed/lease to home, passports, birth certificates, insurance policies)
  • Family and emergency contact information
  • Extra cash
  • Extra cell phone chargers
  • Emergency blanket(s)

Car Kit

In the case of an evacuation or car emergency you should have a supply kit that can last up to three days.

  • A three-day supply of water in the case of an evacuation (one gallon per person per day)
  • Three days’ worth of non-perishable food
  • First aid kit
  • Flashlight with extra batteries
  • Extra phone charger
  • Emergency blanket
  • Map of your area

Pets

If you have pets, you will want to pack additional supplies to ensure their safety in the event of an emergency. It’s a good idea to have a week’s worth of food for each pet, a gallon of water per day, medication on hand, an additional leash, a crate, and any relevant sanitation materials (pet bags, litter, etc.).

Keeping Your Sanity

If you have small children, you may want to include activities for them to stay occupied without the help of electricity. Small games, coloring books and supplies, and other items can be stashed in the emergency kit to keep the family occupied.

For more information on preparing for potential emergencies and disasters, read our blog post about preparing for a fire at home.

Living • May 10, 2022

Springtime Gardening Tips by Region

This time of year, there is much to be done in the garden. Whether you tend to a few veggie plants, have a sprawling urban farm, or tend to a flourishing, flowering sanctuary, spring is a critical time of the year to focus on the health of your garden to keep it fertile heading into summer. Geography and climate play a large role in what a garden needs at different times throughout the year. The following information will help you build out your springtime gardening to-do list depending on where you live. But first, here are a few tips that apply to gardeners of all regions and climates.

Gardening During Spring

Weeding

No matter where you live, weeds can be an issue for your garden. By carving out some time to weed your flower beds and garden in spring, you’ll be ahead of the curve when summer comes around. Use this time to check for any infestations or fungi growing on your plants and flowers.

Watering

Water is the lifeblood of a healthy garden. Keeping your plants and flowers irrigated is paramount, especially so in the spring, since proper watering now will have your garden in top shape as the months get warmer and drier. For plants that require significant watering, place saucers under their pots to catch the excess.

Mulching

Spring is a great time of year to mulch your garden. Mulch helps to keep your soil moisturized when temperatures rise, keeps weeds at bay, and enriches your soil with organic matter.

Clean Your Water Features

Throughout the warmer months of the year, ponds, bird baths, and other water features become a magnet for rapid algae growth. Clean your water filters and remove decaying leaves to keep them clean and algae-free.


A woman shovels dirt in the flower bed of her garden.

Image Source: Getty Images – Image Credit: Jurgute


Springtime Gardening Tips by Region

Pacific Northwest

Pacific Northwesterners can expect to continue to divide perennials while it is still wet out. Once the sun becomes more consistent in late spring, it’s time to transfer any plants you seeded indoors to the outdoors. This time of year brings more sun breaks, which, combined with steady rain, creates rich gardening conditions. Deadhead your rose bushes of any old blooms and begin seeding your annuals.

Northern California

By April, gardeners in Northern California can begin to plant warm-season plants and fertilize perennials. With sunny and dry days dominating the weather pattern, temperatures will begin to rise. Accordingly, it’s important to check your sprinkler and irrigation systems and make repairs/replacements as needed before it gets hot. Check for signs of fungal diseases or evidence of insects throughout the garden before their damage spreads.

Southern California

As the days get hotter in Southern California, gardeners can plant tropical plants and perennials outdoors. This is a great time of year to check whether you have substantial mulch around the base of your plants and trees and add as necessary. If you plan to grow tomato plants, potatoes, or bell peppers, they should be planted by mid-spring.

Southwest

Southwesterners should fertilize their perennials and plant warm-season plants in early spring. When adding mulch, be mindful of your garden’s mulching limit. Adding too much can make it difficult for plants to push up through the ground. Given the fact that this climate typically experiences very few rainy days in mid-Spring and beyond, it’s the right time to plant palm trees and cacti. It’s also the right time of year to give your sprinklers and irrigation system a complete checkup.

Mountain West

There is a bit of waiting game with springtime gardening in the Mountain West, but once the snow has melted, the green thumbs have the green light to get out in the garden. Plant fruit trees and strawberries once it has begun to warm up in April and spread compost around the garden to help reduce weeds and enrich the soil. Once frost is a thing of the past, turn on your irrigation system and check for any leaks. Early May is usually a good time of year to begin planting your vegetable garden.

Market News • Matthew Gardner • Regional Market Report • April 28, 2022

Q1 2022 Western Washington Real Estate Market Update

The following analysis of select counties of the Western Washington real estate market is provided by Windermere Real Estate Chief Economist Matthew Gardner. We hope that this information may assist you with making better-informed real estate decisions. For further information about the housing market in your area, please don’t hesitate to contact your Windermere Real Estate agent.


Regional Economic Overview

The post-COVID job recovery continues. Though data showed the number of jobs dropped in January, February saw gains that almost offset the jobs lost the prior month. As of February (March data is not yet available), the region had recovered all but 47,000 of the more than 300,000 jobs lost due to the pandemic. Of note is that employment levels in Grays Harbor, Thurston, San Juan, and Clallam counties are now above their pre-pandemic levels. In February, the regional unemployment rate rose to 4.1% from 3.7% in December. Although this may be disconcerting, an improving economy has led more unemployed persons to start looking for a job, which has pushed the jobless rate higher. I expect the regional economy to continue expanding as we move into the spring and summer, with a full job recovery not far away.

Western Washington Home Sales

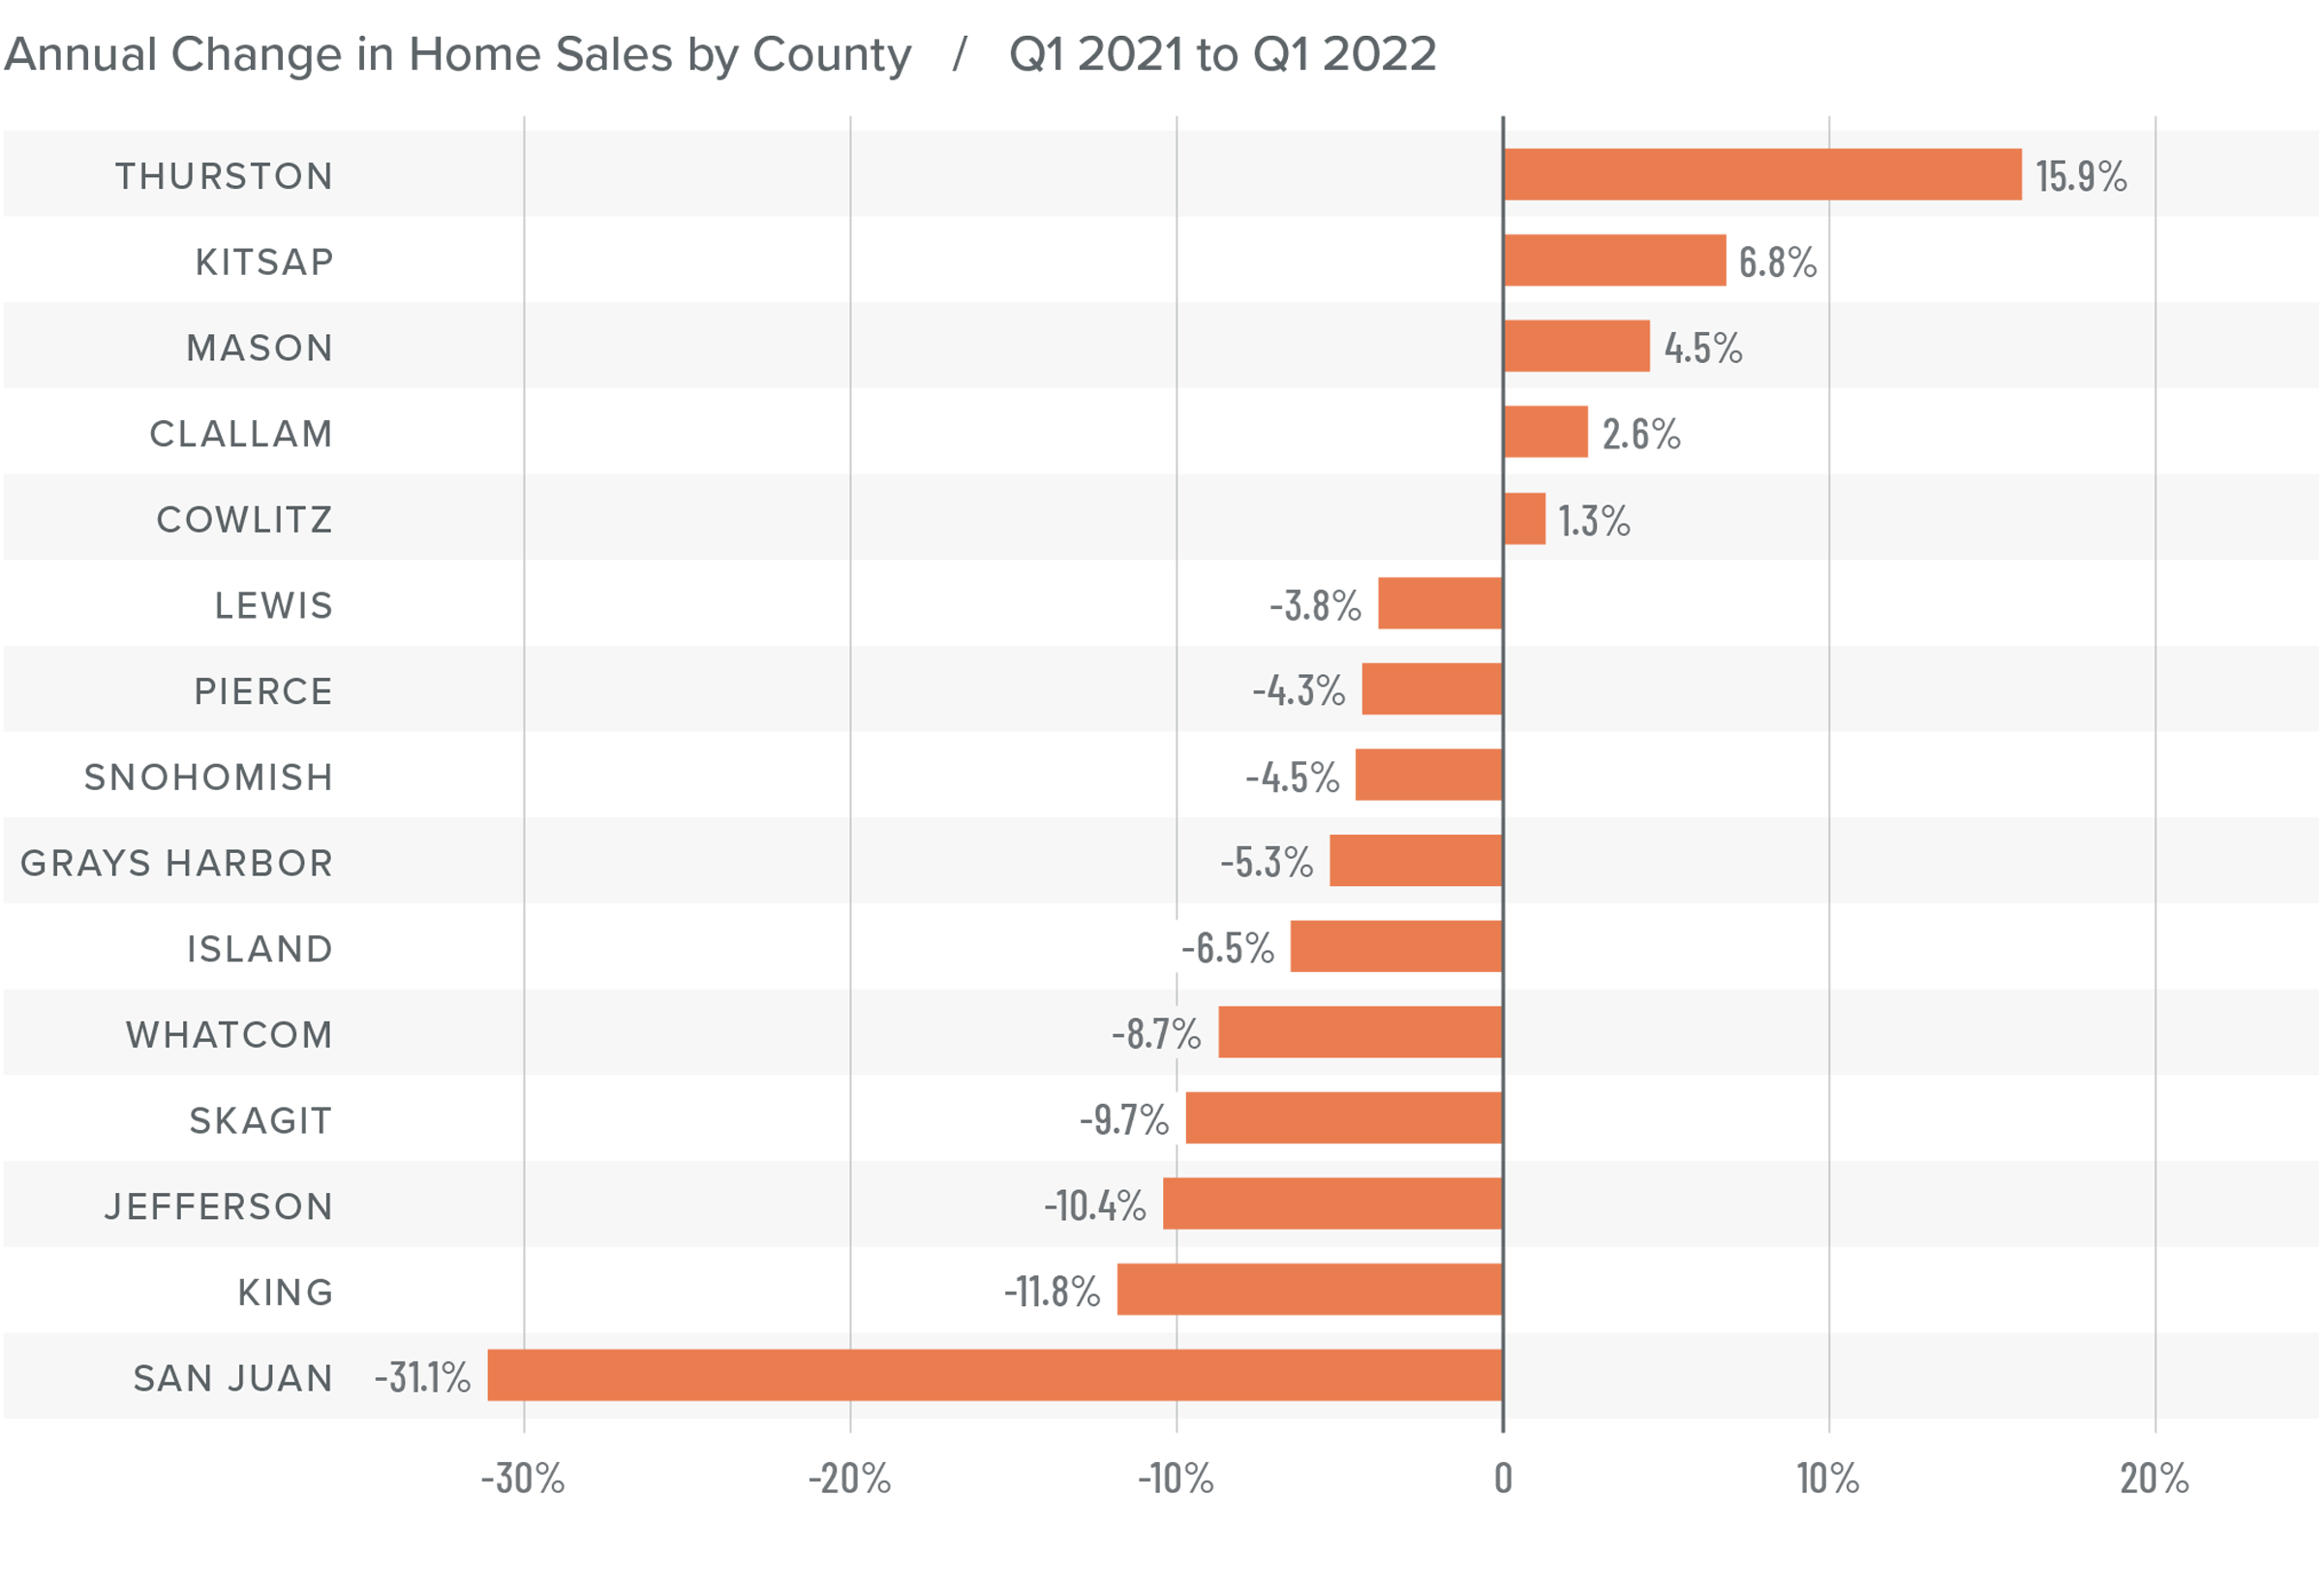
❱ In the first quarter of 2022, 15,134 homes sold, representing a drop of 5.8% from the same period a year ago, and down 31.7% from the fourth quarter.

❱ Yet again, supply-side constraints limited sales. Every county except Snohomish showed lower inventory levels than a year ago.

❱ Sales grew in five counties across the region but were lower across the balance of the counties contained in this report. Compared to the fourth quarter, sales were lower across all market areas.

❱ The ratio of pending sales (demand) to active listings (supply) showed pending sales outpacing listings by a factor of 6.7. Clearly, the significant jump in mortgage rates in the first quarter has not yet impacted demand. Rather it appears to have stimulated buyers partly due to FOMO (Fear of Missing Out)!

A bar graph showing the annual change in home sales for various counties in Western Washington between Q1 2021 and Q1 2022.

Western Washington Home Prices

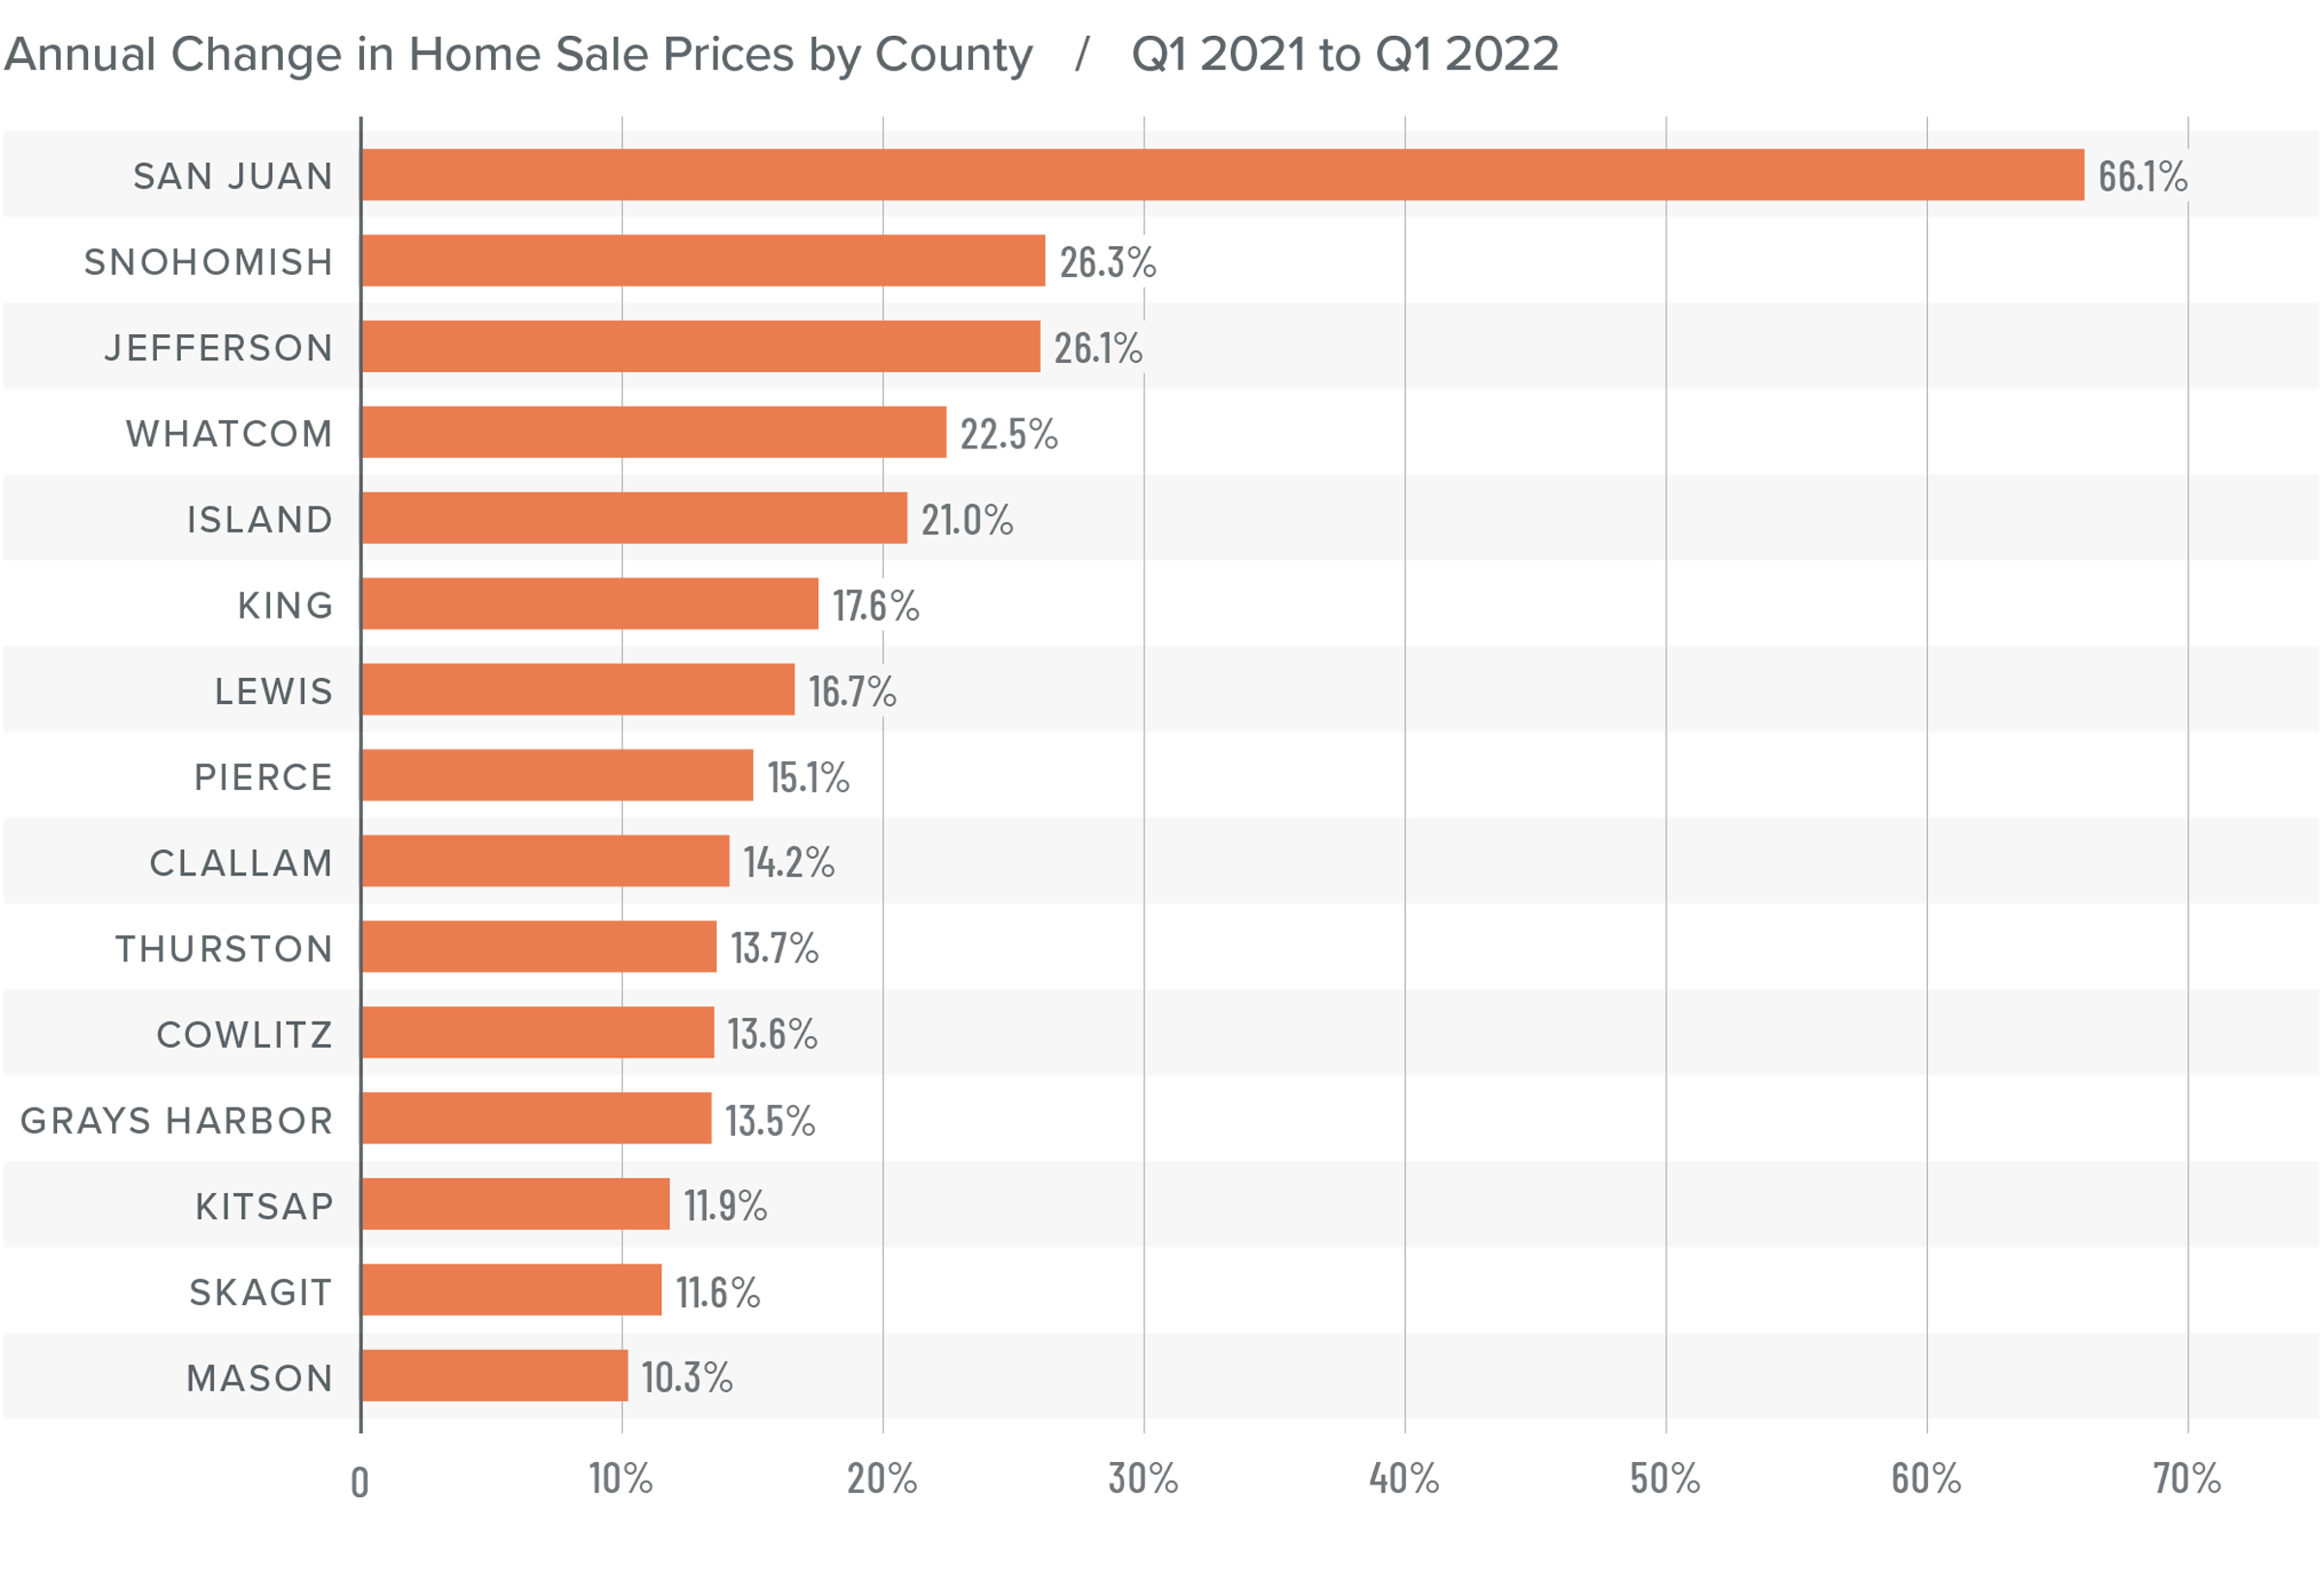
❱ Although financing costs have jumped, this has yet to prove to be an obstacle to buyers, as prices rose 16.4% year-over-year to an average of $738,152. Naturally, there is a lag between rates rising and any impact on market prices. It will be interesting to see what, if any, effect this has in the next quarter’s report.

❱ Compared to the same period a year ago, price growth was again strongest in San Juan County, but all markets saw prices rising more than 10% from a year ago.

❱ Relative to the final quarter of 2021, all but Kitsap (-2.7%), Mason (-1.5%), Skagit (-1.8%), Jefferson (-6.3%), and Clallam (-0.1%) counties saw home prices rise.

❱ The market remains supply starved. While increases in “new” listings suggest that more choice is coming to market, it remains insufficient to meet demand.

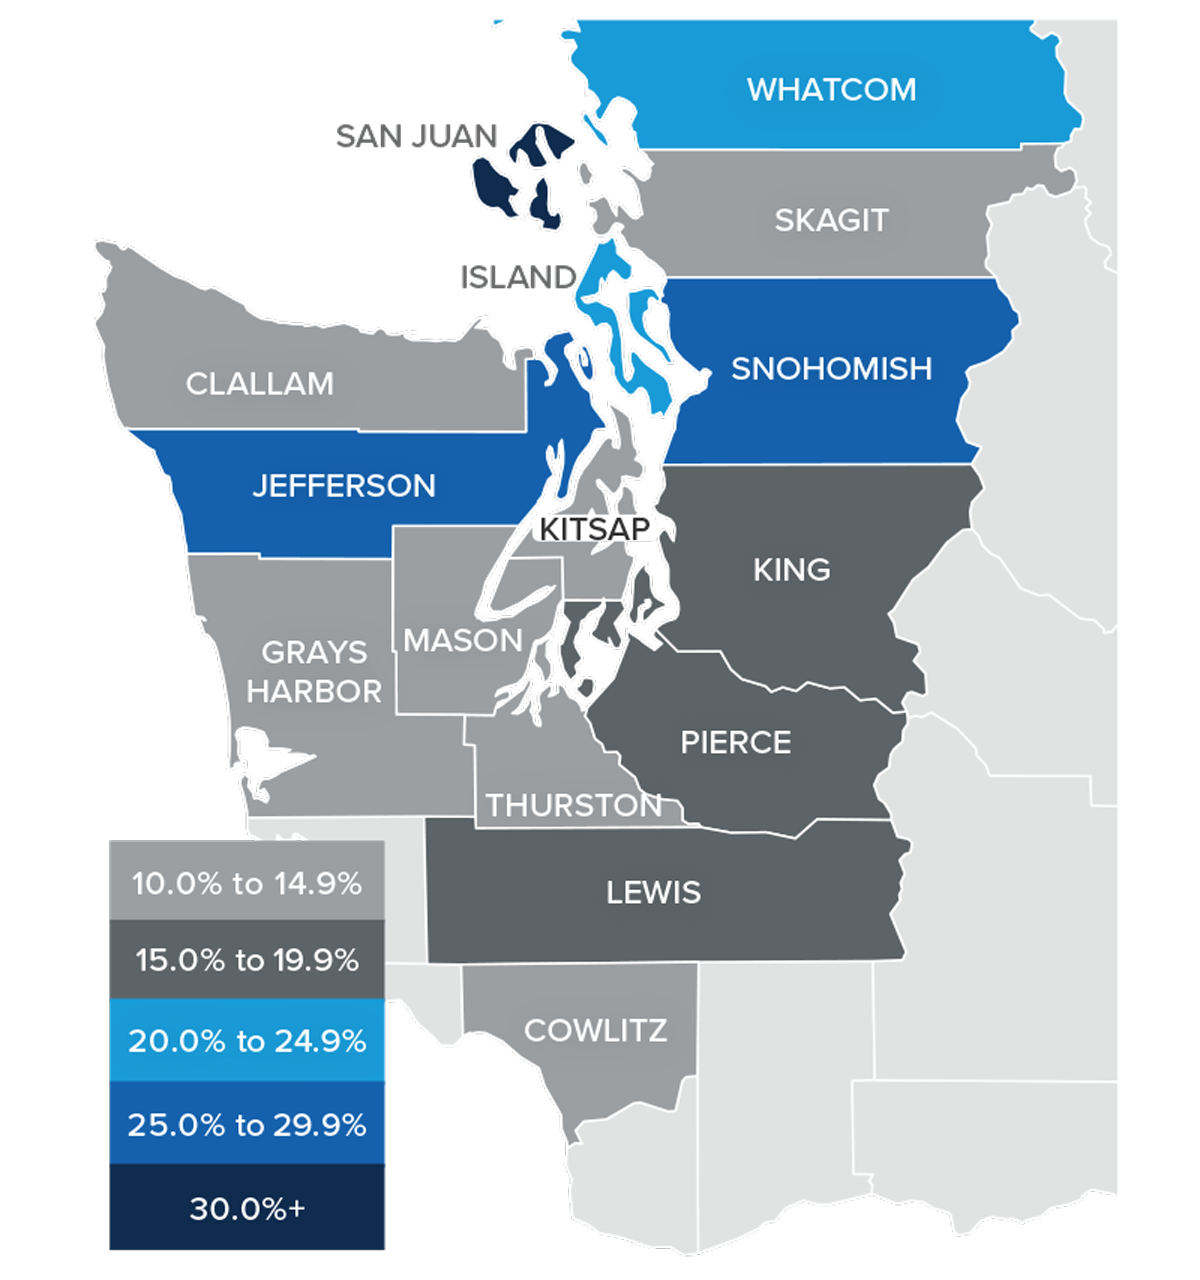
A map showing the year-over-year real estate market percentage changes in various counties in Western Washington for Q1 2022.

A bar graph showing the annual change in home sale prices for various counties in Western Washington from Q1 2021 to Q1 2022.

Mortgage Rates

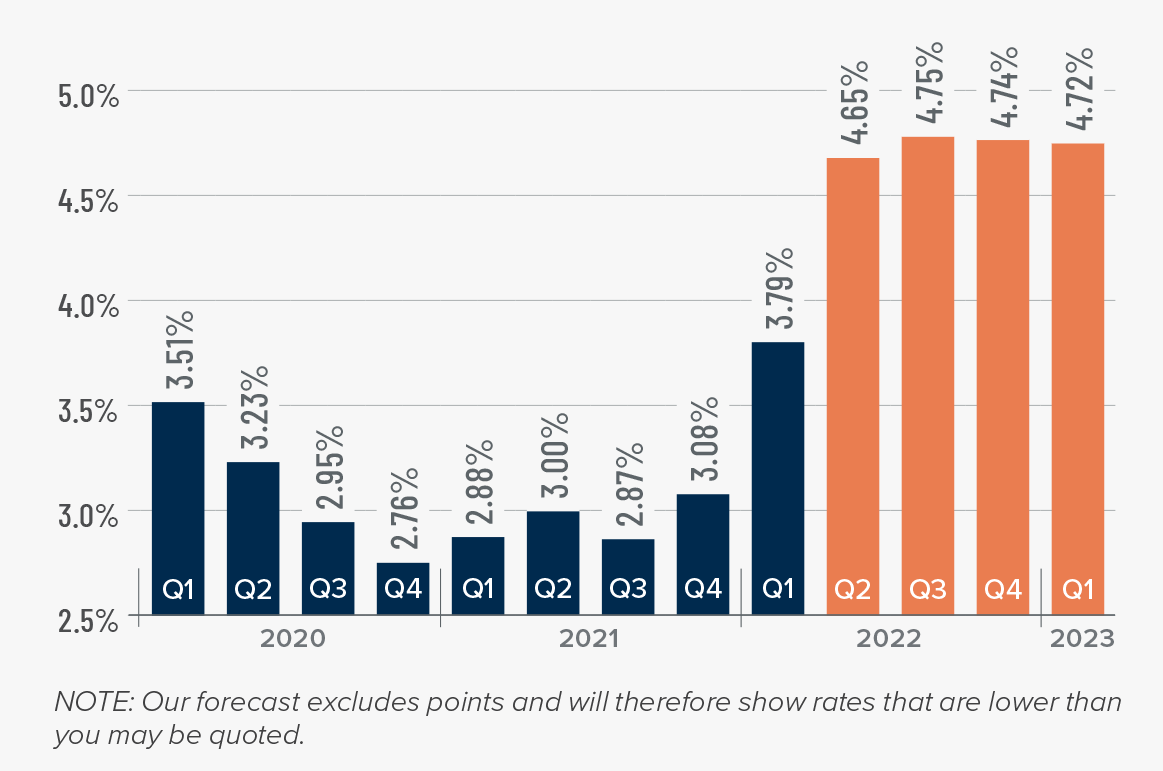
Average rates for a 30-year conforming mortgage were 3.11% at the end of 2021, but since then have jumped over 1.5%—the largest increase since 1987. The surge in rates is because the market is anticipating a seven- to eight-point increase from the Federal Reserve later this year.

Because the mortgage market has priced this into the rates they are offering today, my forecast suggests that we are getting close to a ceiling in rates, and it is my belief that they will rise modestly in the second quarter before stabilizing for the balance of the year.

A map showing the real estate market percentage changes in various counties in Utah during the third quarter of 2021.

Western Washington Days on Market

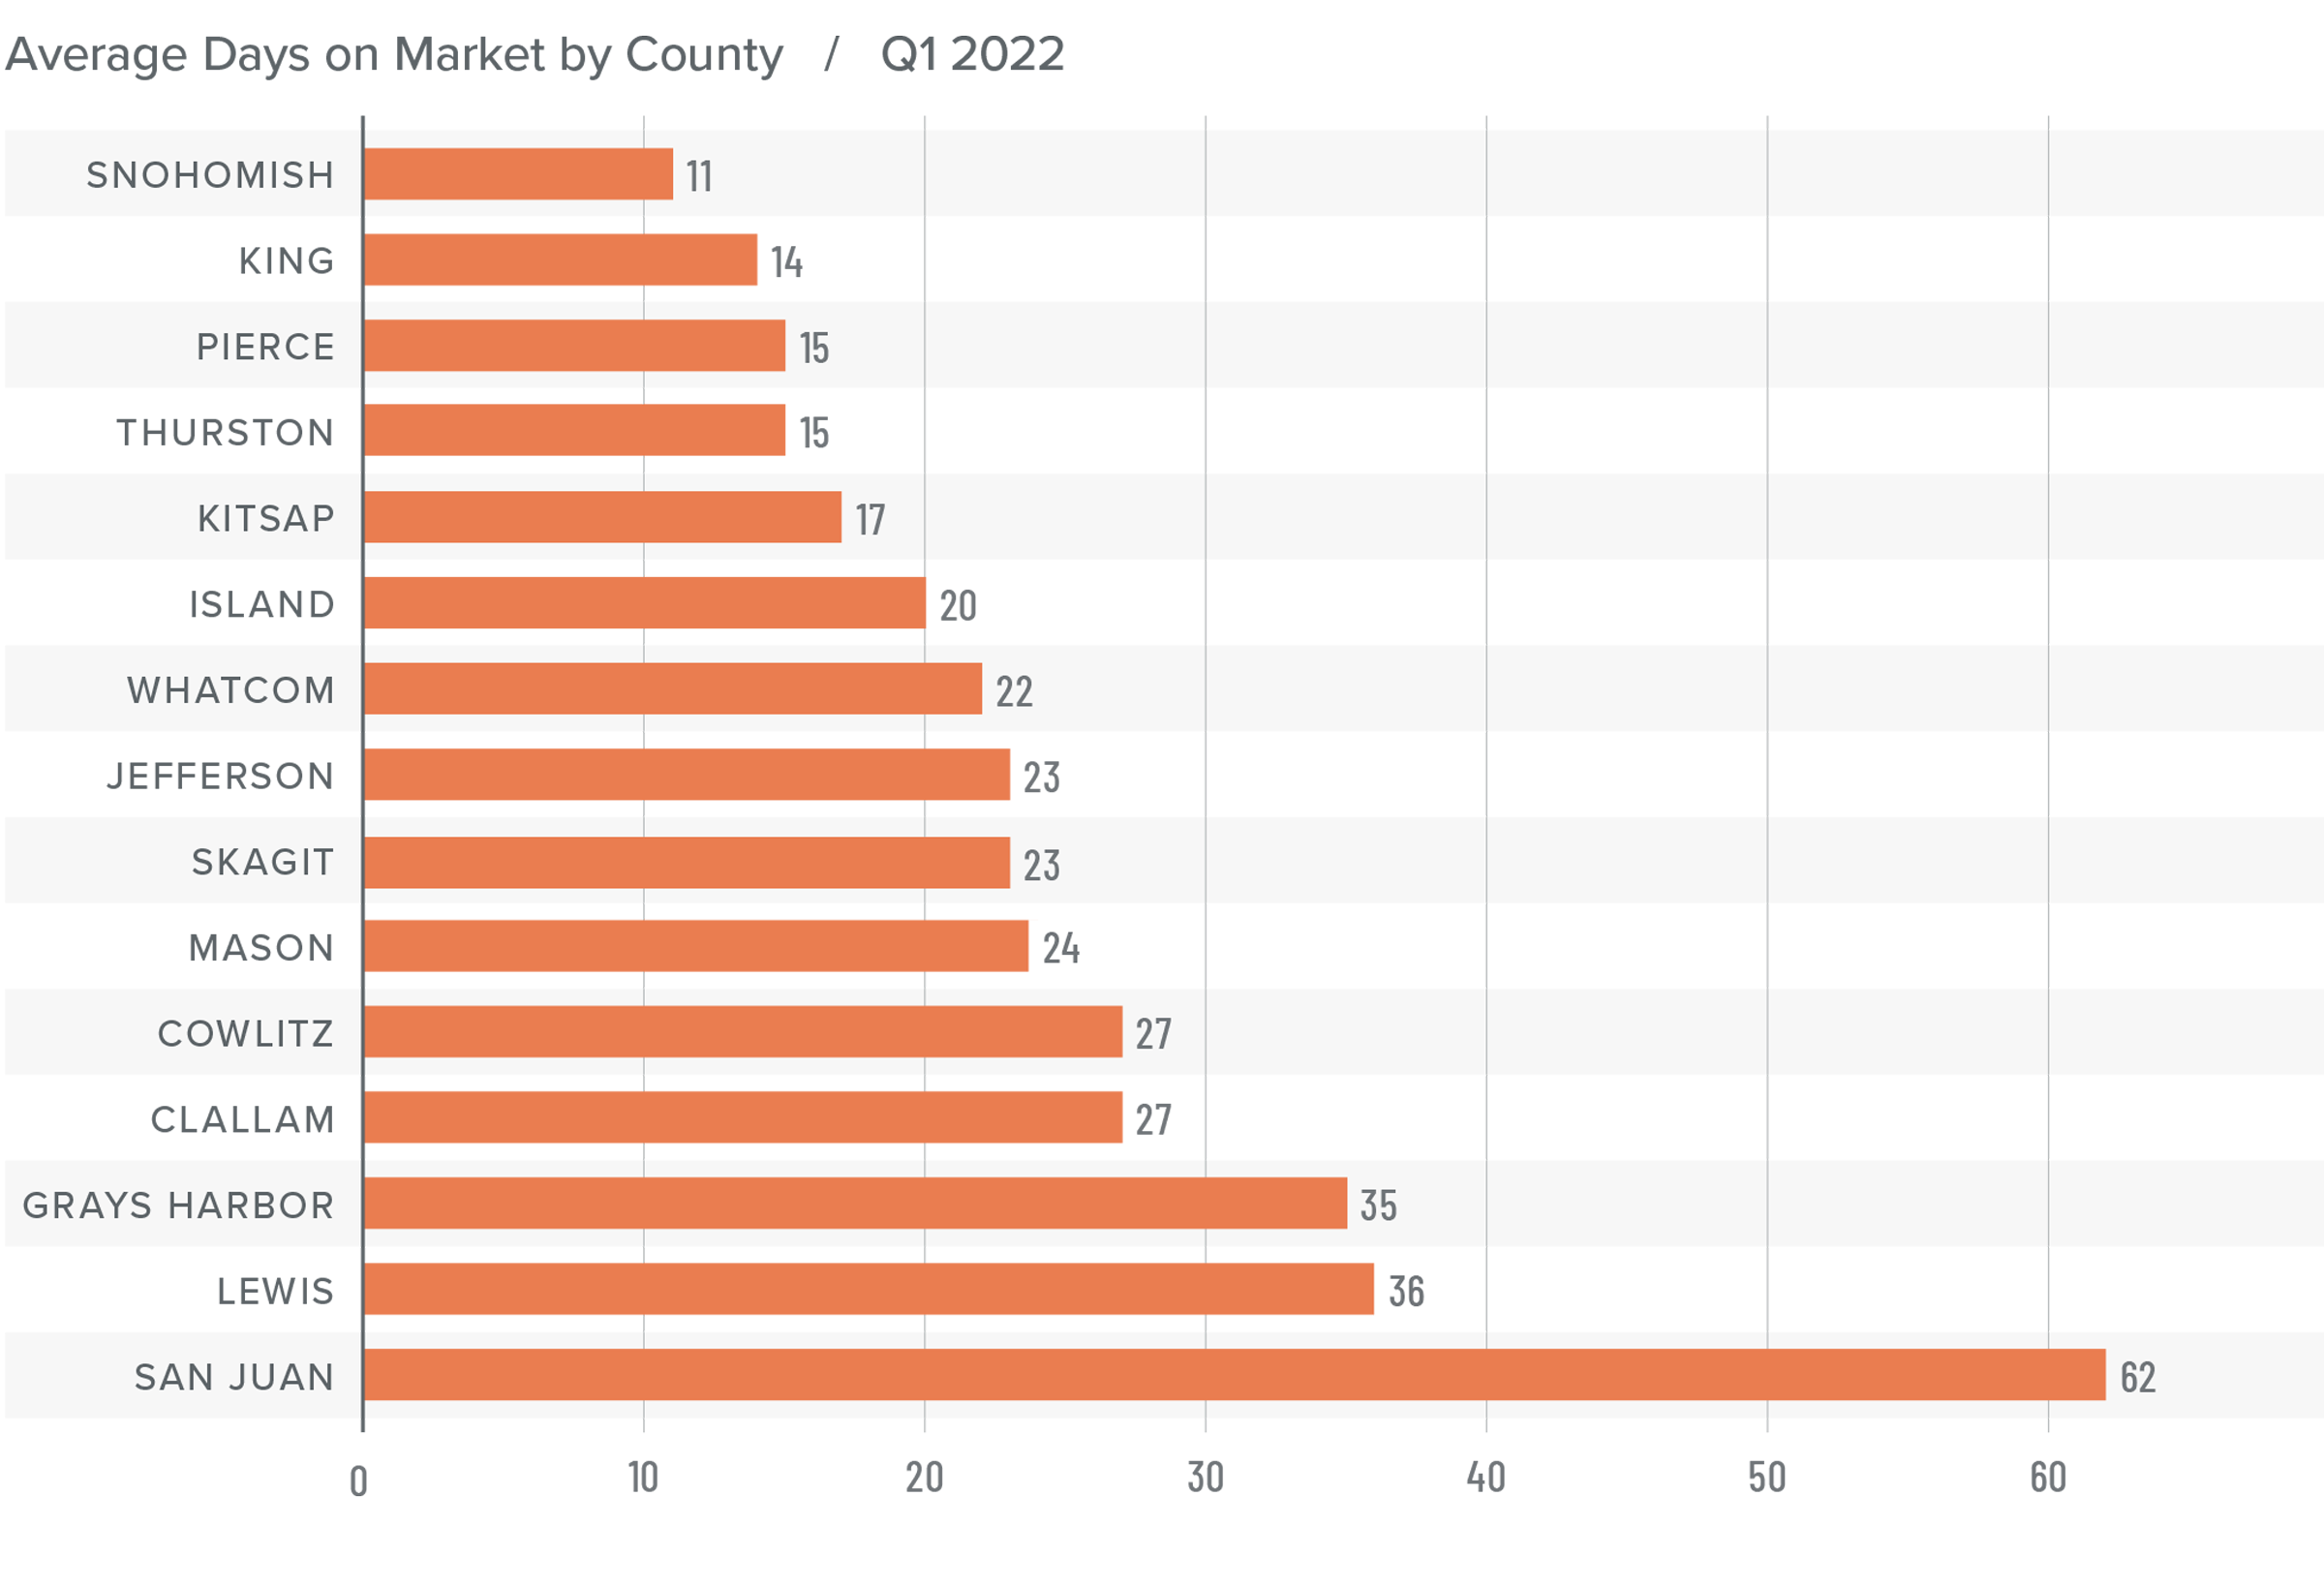
❱ It took an average of 25 days for a home to go pending in the first quarter of 2022. This was 4 fewer days than in the same quarter of 2020, but 2 days more than in the fourth quarter of 2021.

❱ Snohomish, King, and Pierce counties were the tightest markets in Western Washington, with homes taking an average of 11 to 15 days to sell. The greatest drop in market time compared to a year ago was in San Juan County, where it took 23 fewer days for homes to sell.

❱ All but five counties saw average time on market drop from the same period a year ago, but the markets where it took longer to sell a home saw the length of time increase only marginally.

❱ Quarter over quarter, market time dropped in Snohomish, King, and Pierce counties. Jefferson and Clallam counties also saw modest improvement. In the balance of the region the length of time a home was on the market rose, but seasonality undoubtedly played a part.

A bar graph showing the average days on market for homes in various counties in Utah during the third quarter of 2021.

Conclusions

This speedometer reflects the state of the region’s real estate market using housing inventory, price gains, home sales, interest rates, and larger economic factors.

The numbers have yet to indicate that demand is waning amid rising interest rates, but this is sure to become a greater factor as we move into the spring. A leading indicator I pay attention to is changes to list prices and, in most counties, these continue to increase. This suggests that sellers remain confident they will be able to find a buyer even in the face of higher borrowing costs. If this pace of increase starts to soften, it may be an indication of an inflection point, but it does not appear to be that way yet.

A speedometer graph indicating a seller's market in Western Washington during Q1 2022.

Given all the factors discussed above, I have decided to leave the needle in the same position as the last quarter. The market still heavily favors sellers, but if rates rise much further, headwinds will likely increase.

About Matthew Gardner

Matthew Gardner - Chief Economist for Windermere Real Estate

As Chief Economist for Windermere Real Estate, Matthew Gardner is responsible for analyzing and interpreting economic data and its impact on the real estate market on both a local and national level. Matthew has over 30 years of professional experience both in the U.S. and U.K.

In addition to his day-to-day responsibilities, Matthew sits on the Washington State Governors Council of Economic Advisors; chairs the Board of Trustees at the Washington Center for Real Estate Research at the University of Washington; and is an Advisory Board Member at the Runstad Center for Real Estate Studies at the University of Washington where he also lectures in real estate economics.

Market News • Matthew Gardner • April 28, 2022

The Current State of the U.S. Housing Market


This video is the latest in our Monday with Matthew series with Windermere Chief Economist Matthew Gardner. Each month, he analyzes the most up-to-date U.S. housing data to keep you well-informed about what’s going on in the real estate market. 


Hello there, I’m Windermere’s Chief Economist Matthew Gardner, and welcome to this month’s episode of Monday with Matthew. With home prices continuing to defy gravity, mortgage rates spiking, the Fed raising interest rates significantly, a yield curve that is just keeping its nose above water, and some becoming vocal about the possibility that we are going to enter a recession sooner rather than later, it’s not at all surprising that many of you have been asking me whether the housing market is going to pull back significantly, and a few of you have asked whether we aren’t in some sort of “bubble” again.

Because this topic appears to be giving many of you heartburn, I decided that it’s a good time to reflect on where the housing market is today and give you my thoughts on the impact of rising mortgage rates on what has been an historically hot market.

The Current State of the U.S. Housing Market

Home Sale Prices

A slide titled "Home Sale Prices" showing the U.S. media home sale prices from 1990 to 2022. From 1990 to 2006, there was a positive 142% change. From 2006 to 2012, there was a negative 33% change. And from 2012 to 2022, there has been a positive 1315 change, with the most recent U.S. median sale price shown at $357,300.


As usual, a little perspective. Between 1990 and the pre-bubble peak in 2006, home prices rose by 142%, which was a pretty impressive annual increase of 5.6% over a 16 1/2-year period. When the market crashed, prices dropped by 33%, but from the 2012 low to today, prices have risen by 131%, or at an even faster annual rate of 8.6% over a shorter period of time—10 years.

You may think that prices rising at an annual rate that exceeds the pace seen before the market crash is what has some brokers and home buyers concerned, but that really isn’t what has many people scared. It’s this.

Mortgage Rates in 2022

A slide titled "Mortgage Rates in 2022" showing the increase in 30-year fixed conforming mortgage rates between December 30, 2021 (3.11%) and April 14, 2022 (5%).


At the start of 2022, the average 30-year fixed mortgage rate was just a little above 3%. But, over a brief 15-week period, they have skyrocketed to 5%. This has led some to worry that the market is about to implode. Of course, nobody can say that the run-up in home prices hasn’t been phenomenal over the past few years, and it’s certainly human nature to think that “what goes up, must come down,” but is there really any reason to panic? I think not, and to explain my reasoning, let’s look back in time to periods when rates rose significantly and see how increasing mortgage rates impacted the marketplace.

Housing and Mortgage Markets During Times of Rising Rates

A slide titled "Housing & Mortgage Markets During Times of Rising Rates." Two extreme statistics are as follow: Between June 2005 and July 2006 there was a negative 32.3% change in housing starts and between October 1993 and December 1994 there was a negative 12.7% change in home sales.


This table shows seven periods over the past 30 years when mortgage rates rose significantly. On average, rates trended higher for just over a year before pulling back, and the average increase was 1.4%. But now look at how it impacted home prices: it really didn’t. On average, during these periods of rising financing costs, home prices still rose by just over 5%.  Clearly, not what some might have expected. But there were some negatives from mortgage rates trending higher, and these came in the form of lower sales in all but one period and new housing starts also pulled back.

So, if history is any indicator, the impact of the current jump in mortgage rates is likely to be seen in the form of lower transactions rather than lower prices. And this makes sense. Although rising financing costs puts additional pressure on housing affordability, what people don’t appear to think about is that mortgage rates actually tend to rise during periods of economic prosperity. And what does a flourishing economy bring? That’s right. Rising wages. Increasing incomes can certainly offset at least some of the impacts of rising mortgage rates.

Static Equilibrium Analysis – 1/3

A slide titled "Static Equilibrium Analysis" showing that the P&I payment would be $1,365 for a $357,300 home with a 4% mortgage rate, using the February 2022 U.S. median sale price. This assumes the buyer has put down 20% on the home.


To try and explain this, I’m using the median US sale price in February of this year, assuming a 20% down payment and the mortgage rate of 4%. And you can see that the monthly P&I payment would be $1,365. But as mortgage rates rise, and if buyers wanted to keep the same monthly payment, then they would have to buy a cheaper home. Using a rate of 5%, a buyer could afford a home that was 9% cheaper if they wanted to keep the payment the same as it would have been if rates were still at 4%.

But, as I mentioned earlier, an expanding economy brings higher wages, and this is being felt today more than usual, given the worker shortage that exists and businesses having to raise compensation. Average weekly wages have risen by over five-and-a-half percent over the past year—well above the pre-pandemic average of two-and-a-half percent. Although increasing incomes would not totally offset rising mortgage rates, it does have an impact.

Static Equilibrium Analysis – 2/3

A slide titled "Static Equilibrium Analysis" showing what home buyers would be able to afford at different mortgage rates, using the U.S. average household income of $70,611, assuming they've put 20% of their gross income down for the down payment. At 4%, they could afford a home just under $360,000 and at 5%, they could afford a home at $321,038.


To demonstrate this, let’s use the U.S. average household income of $70,611.  Assuming that they’ve put aside 20% of their gross income for a down payment, they could afford a home priced just under $360,000 if mortgage rates were at 4%. As rates rise—and assuming that their income doesn’t—their buying power is reduced by over 10%, or just over $38,000.

Static Equilibrium Analysis – 3/3

A follow up to the "Static Equilibrium Analysis" slide showing that if the average income were raised to $74,848, the buyer would be able to afford a home of $340,302 at a 5% mortgage rate.


But if we believe that incomes will rise, then the picture looks very different. Assuming wages rise by 6%, their buying power drops by just 5% if rates rose from 4% to 5%, or a bit less than $19,000.

Although rates have risen dramatically in a short period, because they started from an historic low, the overall impacts are not yet very significant. If history is any indicator, mortgage rates increasing are likely to have a more significant impact on sales, but a far smaller impact on prices.

But there are other factors that come into play, too. Here I’m talking about demand. The only time since 1968 that home prices have dropped on an annualized basis was in 2007 through 2009 and in 2011, and this was due to a massive increase in the supply of homes for sale. When supply exceeds demand, prices drop.

So, how is it different this time around? Well, we know that the supply glut that we saw starting to build in mid-2006 was mainly not just because households were getting mortgages that, quite frankly, they should never have gotten in the first place, but a very large share held adjustable rate mortgages which, when the fixed interest rate floated, they found themselves faced with payments that they could not afford. Many homeowners either listed their homes for sale or simply walked away.

Although it’s true that over the past two or so months more buyers have started taking ARMs as rates rose, it’s not only a far smaller share than we saw before the bubble burst, but down payments and credit quality remained far higher than we saw back then.

So, if we aren’t faced with a surge of inventory, I simply don’t see any reason why the market will see prices pull back significantly. But even if we do see listing activity increase, I still anticipate that there will be more than enough demand from would-be buyers. I say this for several reasons, the first of which is inflation.

What a lot of people aren’t talking about is the proven fact that owning real estate is a significant hedge against rising inflation. You see, most buyers have a mortgage, and a vast majority use fixed-rate financing. This is the hedge because even as consumer prices are rising, a homeowner’s monthly payments aren’t.  They remain static and, more than that, their monthly payments actually become lower over time as the value of the dollar diminishes. Simply put, the value of a dollar in—let’s say 2025—will be lower than the value of a dollar today.

But this isn’t the only reason that inflation can actually stimulate the housing market. Home prices historically have grown at a faster pace than inflation.

Hedge Against Inflation

A slide titled "Hedge Against Inflation" showing a line graph of the average annual inflation and change in median home price from 1969 to 2021. While the average annual inflation fluctuates between 1% and 5% for most of the chart except for the mid-70s and early-80s, the change in median home price fluctuates between 25% in the late-70s to roughly negative 12% in 2009.


This chart looks at the annual change in total CPI going back to 1969. Now let’s overlay the annual change in median U.S. home prices over the same time period. Other than when home prices crashed with the bursting of the housing bubble, for more than fifty years home price growth has outpaced inflation. And this means we are offsetting high consumer prices because home values are increasing at an even faster rate.

But inflation has additional impacts on buyers. Now I’m talking about savings. As we all know, the interest paid on savings today is pretty abysmal. In fact, the best money market accounts I could find were offering interest rates between 0.5% and 0.7%. And given that this is significantly below the rate of inflation, it means that dollars saved continue to be worth less and less over time while inflation remains hot.

Now, rather than watching their money drop in value because of rising prices, it’s natural that households would look to put their cash to work by investing in assets where the return is above the rate of inflation—meaning that their money is no longer losing value—and where better place to put it than into a home.

Housing as a Hedge Against Inflation

A slide titled "Housing as a Hedge Against Inflation" showing that most home buyers finance their purchase at a fixed-rate of interest, which is not susceptible to inflation. Mortgage payments are fixed, therefore as incomes rise, the payments actually become cheaper.


So, the bottom line here is that inflation supports demand from home buyers because:

  1. Most are borrowing at a fixed rate that will not be impacted by rising inflation
  2. Monthly payments are fixed, and these payments going forward become lower as incomes rise, unlike renters out there who continue to see their monthly housing costs increase
  3. With inflation at a level not seen since the early 1980s, borrowers facing 5% mortgage rates are still getting an amazing deal. In fact, by my calculations, mortgage rates would have to break above 7% to significantly slow demand, which I find highly unlikely, and
  4. If history holds true, home price appreciation will continue to outpace inflation

Demand appears to still be robust, and supply remains anemic. Although off the all-time low inventory levels we saw in January, the number of homes for sale in March was the lowest of any March since record keeping began in the early 1980’s.

But even though I’m not worried about the impact of rates rising on the market in general, I do worry about first-time buyers. These are households who have never seen mortgage rates above 5% and they just don’t know how to deal with it! Remember that the last time the 30-year fixed averaged more than 5% for a month was back in March of 2010!

And given the fact that these young would-be home buyers have not benefited from rising home prices as existing homeowners have, as well as the fact that they are faced with soaring rents, making it harder for them to save up for a down payment on their first home, many are in a rather tight spot and it’s likely that rising rates will lower their share of the market.

So, the bottom line as far as I am concerned is that mortgage rates normalizing should not lead you to feel any sort of panic, and that current rates are highly unlikely to be the cause of a market correction.

And I will leave you with this one thought. If you agree with me that a systemic drop in home prices has to be caused by a significant increase in supply, and that buyers who are currently taking out adjustable-rate mortgages are more qualified, and therefore able to manage to refinance their homes when rates do revert at some point in the future, then what will cause listings to rise to a point that can negatively impact prices?

It’s true that a significant increase in new home development might cause this, but that is unlikely. And as far as existing owners are concerned, I worry far more about a prolonged lack of inventory. I say this for one very simple reason and that is because a vast majority off homeowners either purchased when mortgage rates were at or near their historic lows, or they refinanced their current homes when rates dropped.

And this could be the biggest problem for the market. Even if rates don’t rise at all from current levels, I question how many owners would think about selling if they were to lose the historically low mortgage rates that they have locked into. It is quite possible that for this one reason, we may experience a tight housing market for several more years.

Windermere Community • April 25, 2022

Windermere Foundation Sets Sights on $50 Million in Total Donations

In honor of Windermere’s 50th anniversary, the Windermere Foundation has set a goal to reach $50 million in total donations raised by the end of 2022. At the end of last year, the Foundation surpassed $46 million in total donations, leaving a nearly $4 million gap to eclipse the $50 million mark. Through the fundraising efforts of offices across the Windermere footprint, 2022 is off to a strong start. Here are a few highlights from early 2022.

Windermere Northern Colorado

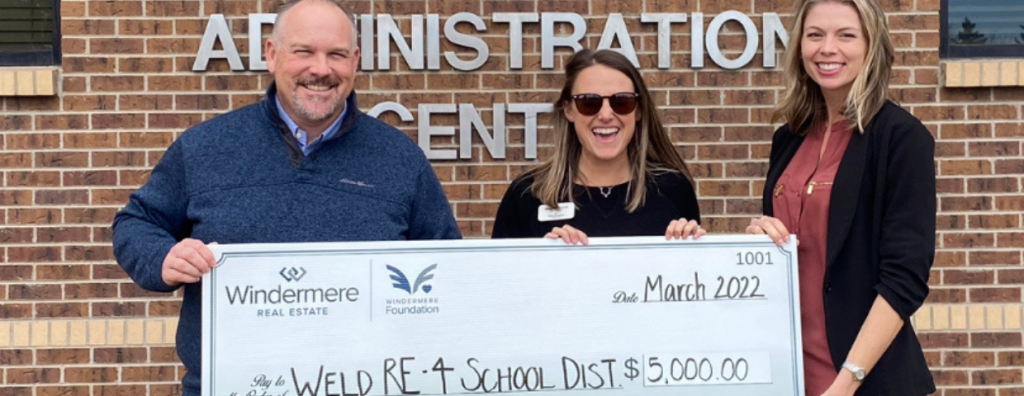
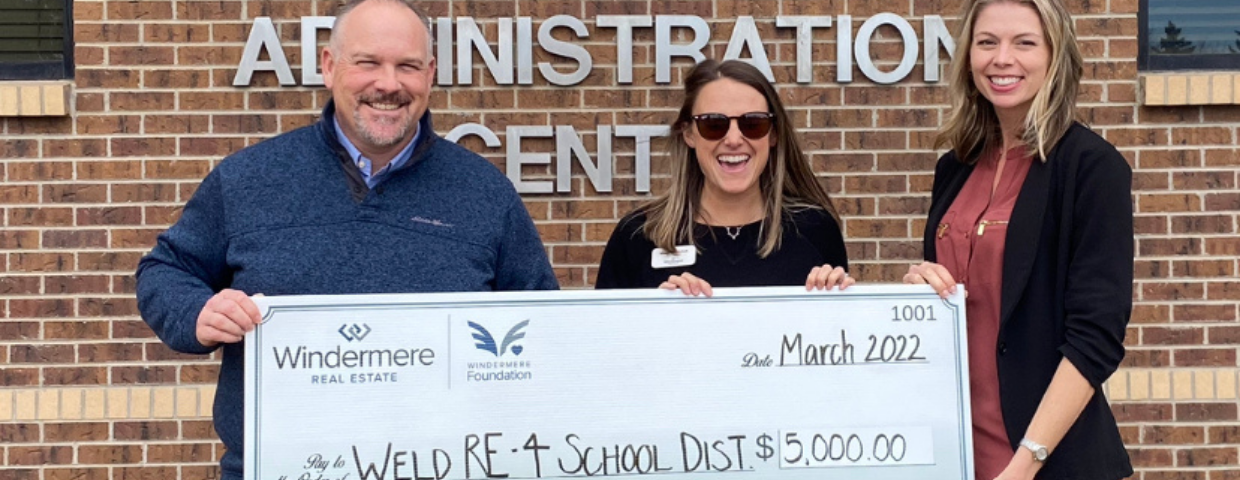
Windermere Northern Colorado has burst out the gate this year, organizing multiple fundraising events and supporting multiple local organizations throughout the early months of 2022. ChildSafe, based in Fort Collins, CO, provides children with responsive treatment, education, and recovery from child abuse. The Windermere office has supported ChildSafe in the past and wanted to continue to do so in 2022, donating $10,000 to them in February to help heal the trauma experienced by local victims of child abuse. In March, the office directed its giving efforts to the Weld County School District, with the goal of helping local children and families struggling with homelessness. Windermere Northern Colorado’s donation of $5,000 allowed the school district to purchase grocery gift cards for local families and students in need.


Two women and a man hold up a check for $5,000.

Pictured left to right: Weld RE-4 School District Director of Exceptional Student Services JonPaul Burden, Meaghan Nicholl, Elizabeth Dolton.


Windermere Utah

For the agents, owners, and staff at Windermere Utah, The Make-A-Wish Foundation has a special place in their hearts. Supporting children in need in their community has been a focal point of the office’s giving over the years, so when looking to kickstart their 2022 giving, Make-A-Wish was a natural fit. The office donated $5,000, which will go toward the organization’s ability to grant another child’s wish.


Windermere Coast Offices (Oregon)

The Windermere Coast Offices of Gearhart and Cannon Beach have made it a point to support the aspirations and success of women in their community. They’ve been loyal supporters of the Astoria, OR branch of the American Association of University Women (AAUW) since learning about the organization years ago. AAUW provides scholarships for women who may not otherwise have the resources to pursue and succeed in their educational and vocational goals.


To learn more about the Windermere Foundation, visit windermerefoundation.com.

Seller • April 18, 2022

Landscaping Tips That Can Increase Your Home’s Value

When you own a home, there’s a natural desire to invest in landscaping projects that help beautify your yard. But for those who are preparing to sell, the emphasis should be on specific projects that boost your home’s curb appeal and add to its value. The following landscaping tips can help you position your home to sell at the best price. We also recommend talking with your agent about the best landscaping ideas for your home that buyers in your area are looking for.

Landscaping Tips That Can Increase Your Home’s Value

Flower Beds

Beautifying your flower beds is a matter of making improvements in two areas: the flower beds themselves and the border surrounding them. Flower-lined pathways leading toward your home’s front door help guide buyers’ eyes and create a natural aesthetic order to your front yard. Plant colorfully to inspire a vibrant look or choose fewer flowers for a more uniform consistency. Add fresh mulch or beauty bark to your flower beds to make them pop. Creating a border with stone, brick, clay, or another similar material will help delineate flower beds from grass while delivering a clean, refined aesthetic to your property.

If you’re designing new borders to your flower beds, think about the traffic patterns, the orientation of the house in relation to the rest of your neighborhood, and your front yard’s location to ultimately settle on the best sight lines. Spend time weeding the area where your border will go. To dissuade future weed growth, consider adding a thin layer of sand or gravel between the dirt and your border pavers. Finally, clean your hardscaping with an outdoor cleaner or pressure washer to get rid of built-up dirt and moss.


A colorfully landscaped front yard on a sunny day.

Image Source: Getty Images – Image Credit: Elenathewise

Lawn Care

A fresh lawn will make a solid first impression on prospective buyers. Here are a few basic lawn care tips:

  • Fertilize at the appropriate time of year for your local climate
  • Set your lawn mower blades at the proper height to ensure you’re not cutting your grass too short
  • Water regularly to keep your lawn healthy

If you live in an arid climate, grass alternatives may be a more popular local choice. No matter where you live, once you’ve decided to sell, you can rest assured that spending time and energy on caring for your lawn will pay dividends once you’ve staked your “for sale” sign.

Landscaping Lighting

Once you’ve fixed up your garden beds and tended to your lawn, you’ve done well to ensure that your home’s landscaping will look its best—during the daylight, that is. To ensure that buyers feel the work you’ve put into your home around the clock, consider installing landscape lighting. This will help to put your home’s qualities on full display during the nighttime, while also adding a welcoming touch for potential buyers and passersby.

Front Porch

Add planters to your front porch to create flow from your front yard to your entrance. For the ultimate front porch aesthetic, think of ways that you can create symmetry with your planter boxes. Nest them along the borders of windows, select planter boxes with dimensions that compliment a seated bench, or place identical boxes on either side of your front door. This will direct attention to your home’s front entry and helps to instill that all-important first impression in buyers’ minds.