Buyer October 10, 2021

Making an All-Cash Offer on a House

The more competitive the housing market, the greater the lengths buyers will go to to make themselves stand out amongst the competition. Making an all-cash offer is one such way a buyer can differentiate themselves. In a seller’s market, listings commonly receive multiple offers, often over their original asking price. This will typically lead to bidding wars between buyers, and all-cash offers will often enter the fold. Keep the following information in mind if you’re thinking about making an all-cash offer on a house.

Making an All-Cash Offer on a House

What is an all-cash offer?

When a buyer makes an all-cash offer, it means they have the funds available to purchase the house in a liquid account and won’t need to secure a home loan. Once the buyer has shown they have enough cash to make the purchase, they will put down an earnest money deposit. The remaining amount they owe will typically be wire transferred at a later date.

Whereas financed offers are tied to an approval process with a lender, all-cash offers are not because the buyer has already proven they have the amount required to purchase the property on-hand. This can create a less risky and more streamlined selling process, which sellers may view as favorable.

How do I make an all-cash offer on a house?

First, there’s the question of how to organize the funds you’ll use to make your all-cash offer. Though it is not required, lumping your cash together into one account may help to simplify the offer process. This way, when it’s time to show the seller a bank statement proving you have the necessary funds for the purchase, you won’t have to spend additional time tracking down money from multiple accounts.

Once you’ve found the house you’d like to purchase, work closely with your agent to formulate an offer. Knowing that you’re prepared to make an all-cash offer bodes well for negotiations. Your agent may use the guaranteed money and quick closing times as leverage for driving down the price of the offer. You’ll also be able to handpick your contingencies, which can further sweeten the deal for the seller. This may come in handy in a highly competitive market, where simply making an all-cash offer may not be enough to win out. After the offer has been agreed upon and signed by both parties, it’s on to escrow and closing. All-cash offers often lead to quick sales with short closing times. So, it may only be a matter of days before you have the deed to your new home in hand.


An older man and woman examine financial paperwork at their dinner table.

Image Source: Getty Images


What are the pros and cons of all-cash offers?

Pros: All-cash offers essentially cut out the middleman from the buying process, allowing you to purchase a home without intervention from a lender. You’ll also save on the closing costs that would have stemmed from securing a loan. The closing process will be shorter, which can be helpful for both buyers and sellers who are looking to move quickly. Additionally, an all-cash offer may be the antidote for navigating the challenges of a highly competitive market by increasing your buying power and giving your agent leverage when approaching negotiations.

Cons: The greatest drawback with making an all-cash offer is self-explanatory—you will have less cash available to you once the purchase goes through. This means you’ll be cutting into your reserves for the myriad of expenses that come with homeownership. Before proceeding with an all-cash offer, make sure you’ve properly budgeted for closing costs, taxes, repairs, and any remodeling projects you have in mind.

Market NewsMatthew Gardner October 3, 2021

9/27/2021 Housing and Economic Update from Matthew Gardner

This video is the latest in our Monday with Matthew series with Windermere Chief Economist Matthew Gardner. Each month, he analyzes the most up-to-date U.S. housing data to keep you well-informed about what’s going on in the real estate market.  


Hello there!  I’m Windermere Real Estate’s Chief Economist, Matthew Gardner, and welcome to the latest episode of Mondays with Matthew.


Today we are going to take a look at the latest Home Purchase Sentiment Index survey that was just put out by Fannie Mae. And for those of you who may not be familiar with this survey, it’s actually pretty important and one that I track closely as it’s the only national, monthly, survey of consumers that’s focused primarily on housing.


The survey shows the responses of 1,000 consumers across the country to roughly 100 survey questions on a wide range of housing-related topics. Now, don’t worry, we aren’t going to look at all 100 questions – just the ones that solicit consumers’ evaluations of housing market conditions and that also address topics related to their home purchase decisions.

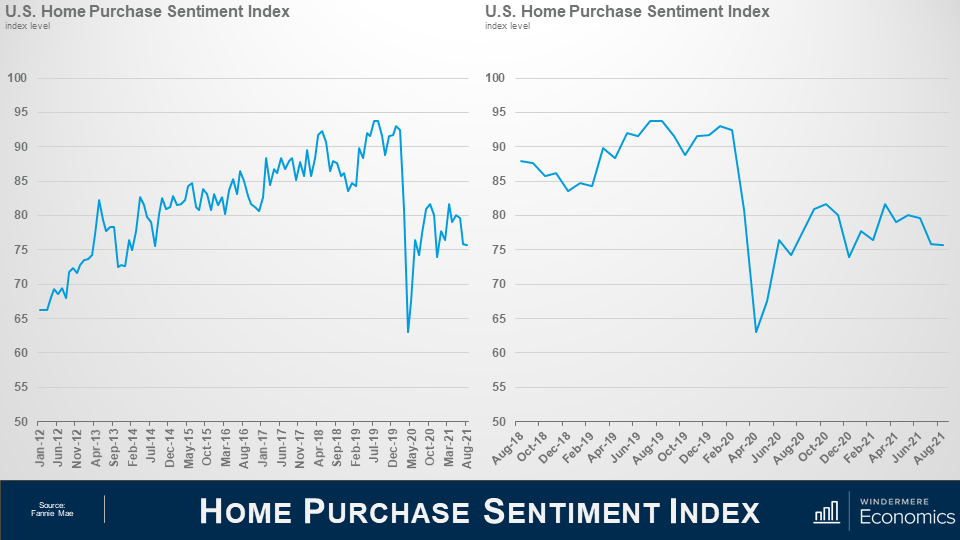
Two line graphs side by side on a presentation slide titled “Home Purchase Sentiment”. On the Left is a graph showing the U.S. Home Purchase Sentiment Index Index Level from January 2021 to August 2021. From January 2021 to July 2019, there’s a slow increase from just above 65 to a peak just under 95. In May 2020 however, there’s a sharp valley that dips between 60 and 65. On the right shows the last three years where the Pandemic induced drop is more clear. The drop in sentiment index lasted roughly from February 2020 to August 2020, and has held relatively stable ever since, sitting between 75 and 83.


So, as you can see here, the overall index was trending higher pretty consistently until the pandemic happened which had massive, but temporary, impacts. And looking the last 3-years, you can get a better idea as to the speed of the pandemic induced drop – pretty remarkable.

Now, you will also see that the index recovered quite quickly; however, it fell again last fall as the pandemic was not going away at the speed many had hoped for – it rose again this spring but has been pulling back for the past few months but, that said, the August index level essentially matched the level seen in July.

Now let’s look at the questions that are used to create of the index number and how consumers responded.


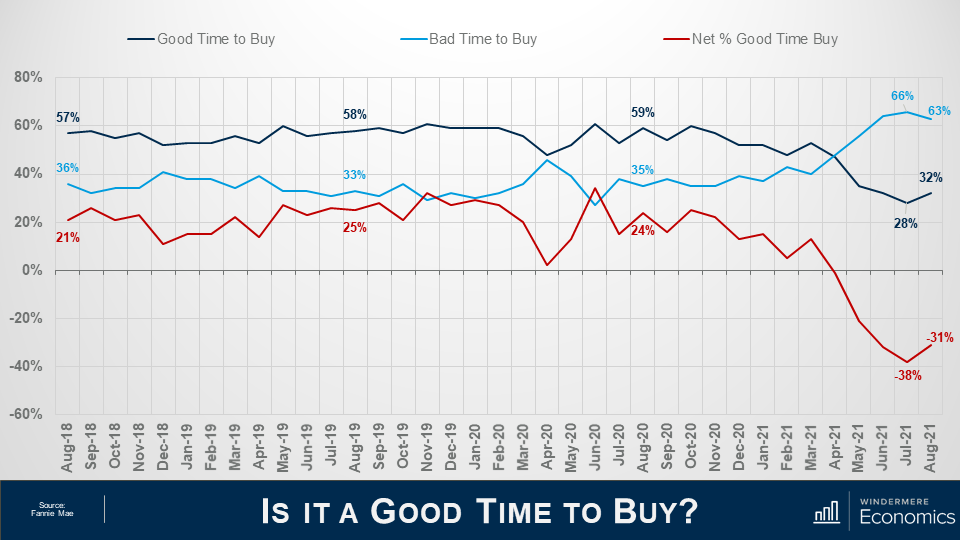
Three lines on the same graph on a slide titled “Is it a Good Time to Buy?” which shows sentiment compared to those who think it’s a good time to buy and those who think it’s a bad time to buy. The graph’s x axis shows the percentage of respondents and the y axis shows dates from August 2018 to August 2021. The navy line indicates “Good Time to Buy” the light blue indicates bad time to buy, and the red indicates the net percentage good time to buy. The navy line sits above the other two lines for the most part, but it dips below and switches places with the light blue line in April 2021. The net share of those who say it’s a good time to buy jumped 7%, which is the first time it’s improved in the last four months.


When asked whether it was a good time to buy a home, the percentage who agreed with that statement rose from 28 to 32%, while the share who thought that it is a bad time to buy dropped from 66 to 63%. And, as a result, the net share of those who say it is a good time to buy jumped 7 points month over month and its notable that this is the first time the net share number has improved in the past 4-months.

What I see here is that – although improving modestly, the general consensus is that it is not a good time to buy and that sentiment is being driven by two things: One – there are still not enough homes on the market, and two, rapidly rising prices are scaring some people.


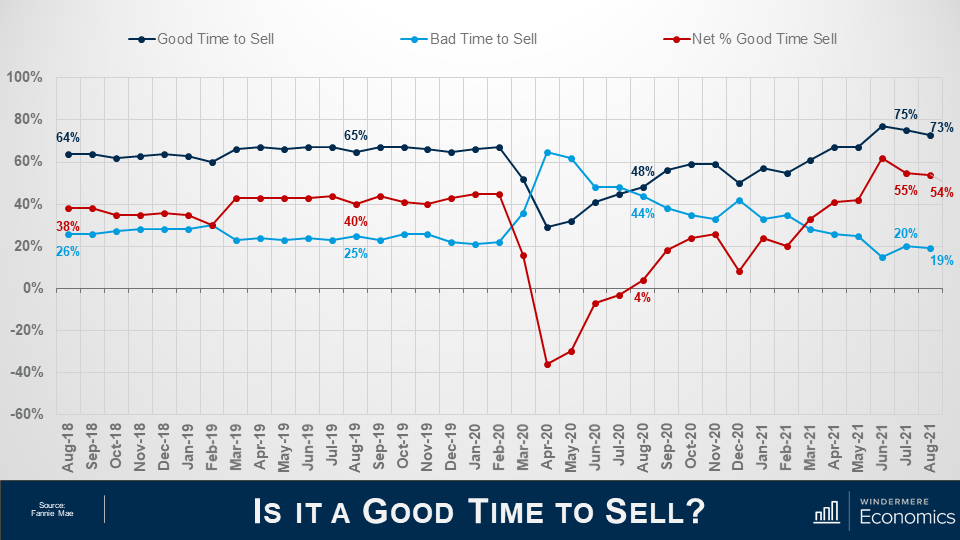
Three lines on the same graph which shows seller sentiment. The presentation slide I titled “Is it a Good Time to Sell? The graph’s x-axis shows percentages from -60% to 100% and the y-axis shows thedates from August 2018 to August 2021. The navy line represents those who think it’s a good time to sell, the light blue line indicated those who think it’s a bad time to sell,and the red line indicates the net percentage of people who think it’s a good time to sell. The navy line is mostly on the higher end, sitting in the 65% range, until March 2020 when it flips with the light blue line. They switch back in August 2020 when they are 48% and 44%. The different grows in the last few months, landing at 54% net difference in August 21.


And when asked if they thought it was a good time to sell their homes it was interesting to see that share drop from 75 to 73% while the percentage who said that it’s a bad time to sell dropped 1 point to 19% and as a result, the net share of those who said it was a good time to sell pulled back by 1% but it still indicates that more owners think that it is a good time to sell than don’t.


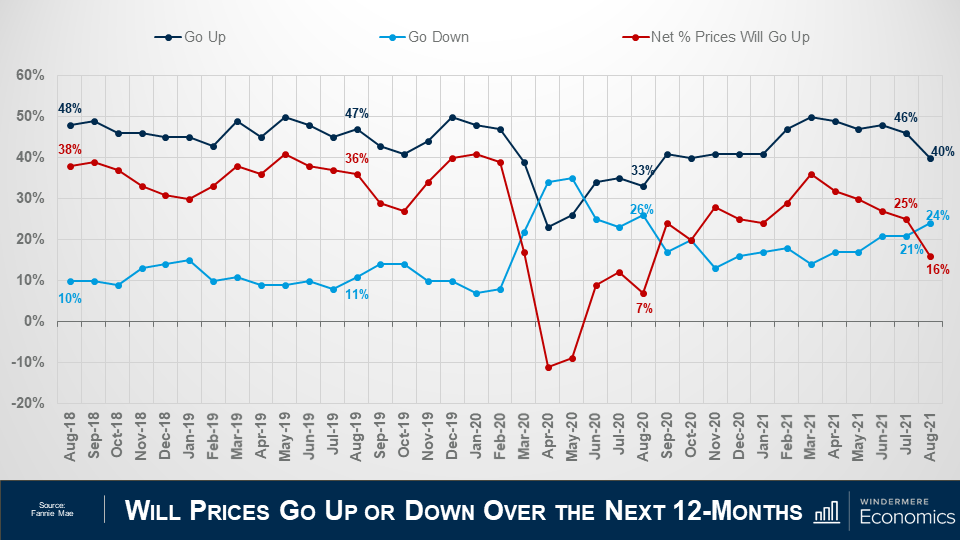
Three lines on the ame grah to compare different sentiments about whether home prices will go up in the next 12 months. The slide is titled “Will Prices Go Up or Down Over the Next 12-Months” and the x-axis shows the percentage of respondents from -20% to 60%, and the y-axis shows the dates from August 2018 to August 2021. The navy lineindicates the respondents who thinkprices will go up, the light blue line shows the respondents who think prices will go down, and the red line shows the net percentage difference. In August 2021 net share of Americans who say home prices will go up dropped by 9 points – from 25%, down to 16%.


Looking now at the direction of home prices over the next 12-months, the percentage who think that home prices will rise fell from 46 to 40%, while the percentage who expected home prices to drop rose from 21 to 24%.

As a result, the net share of Americans who say home prices will go up dropped by 9 points – from 25%, down to 16%.

Although this may sound concerning, I should add that the share of respondents who thought that home prices will remain static over the next year rose from 27% to 31%.


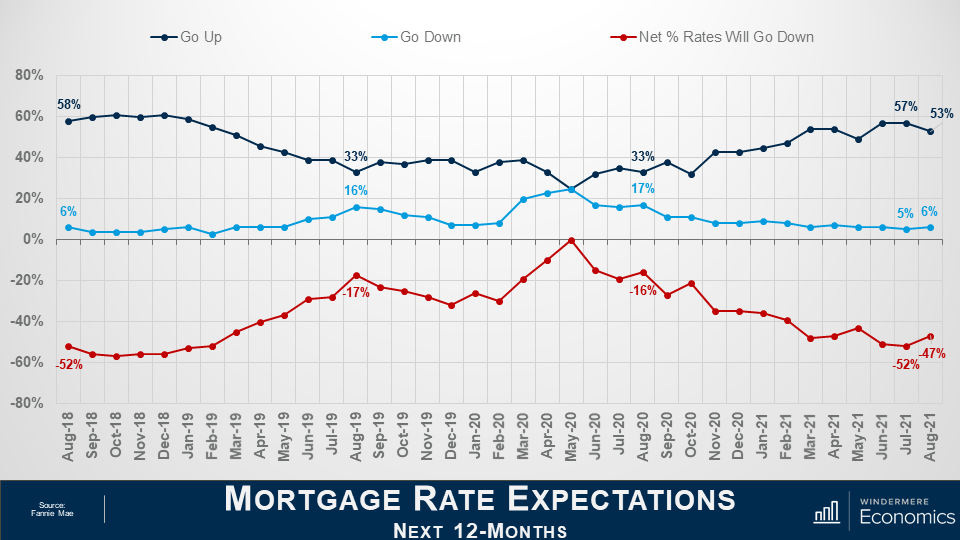
Three lines on the same graph comparing the different expectations of people considering the mortgages rates of the next 12 months. The slide is titled “Mortgage Rate Expectations for the Next 12-Months” and the graph’s x-axis goes from -80% to 80% and the y axis shows dates from August 2018 to August 2021. The navy line indicates respondents who think mortgage rates will go up, the medium blue line shows those who think mortgage rates will go down, and the red lines shows the net percentage rates will go down. Most people think rates will go up. The net share of Americans who believed that mortgage rates will go down over the next 12 months rose by 5%


On the financing side, the share who think mortgage rates will rise over the next 12 months dropped from 57 to 53%, while the percentage who believed rates would be lower rose from 5% to 6% and, as a result, the net share of Americans who believed that mortgage rates will go down over the next 12 months rose by 5%, and with 35% of respondents thinking that that rates will hold steady – it’s clear to me that a vast majority are not worried about mortgage rates rising.

The takeaways for me so far are that consumers tempered both their recent pessimism about homebuying conditions and their upward expectations of home price growth.

Most notably, a greater share of consumers believe that it’s a good time to buy a home – though that population remains firmly in the minority at only 32% – while the ongoing plurality of respondents who expect home prices to go up over the next 12 months dropped but was still well above the 24% of consumers who believe home prices will fall.

Now, there are two more questions that are worth looking at which aren’t directly related to home buyers and sellers but are still important as they look at employment and incomes.


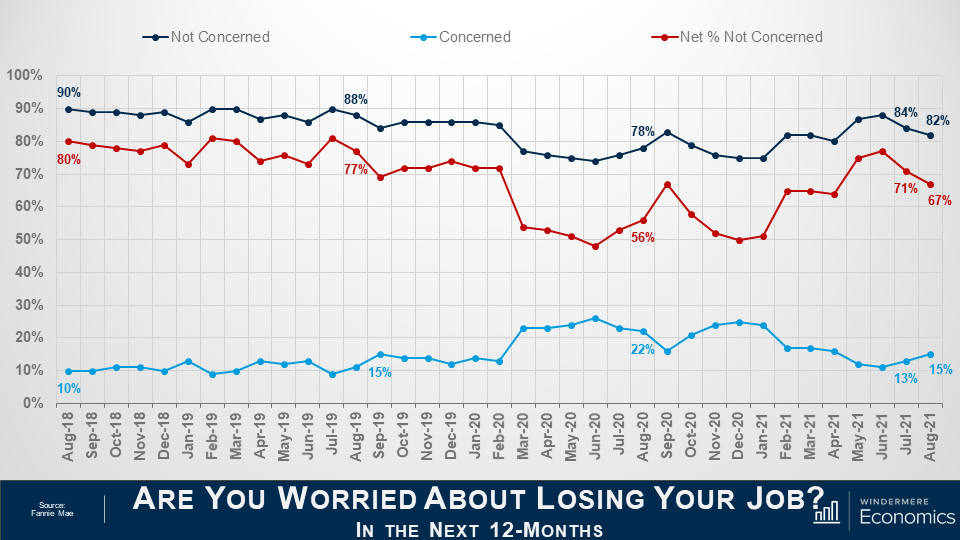
Titled “Are you worries about losing your job in the next 12 months” three lines on the same grph show the comparison of respondents between Augut 2018 and August 2021. The navy line represents the respondents who are not concerned, the light blueline shows those who are concerned, and the red line shows the net percentage not concerned. The net share of Americans who say they are not concerned about losing their job fell by 4 percentage points month over month, but remains well above the level seen a year ago.


The percentage of respondents who said that they are not concerned about losing their job in the next 12 months remains very high at 82%, but it did drop by 2 points month-over-month, while the percentage who said that they are concerned ticked up to 15% from 13%. As a result, the net share of Americans who say they are not concerned about losing their job fell by 4 percentage points month over month, but remains well above the level seen a year ago.


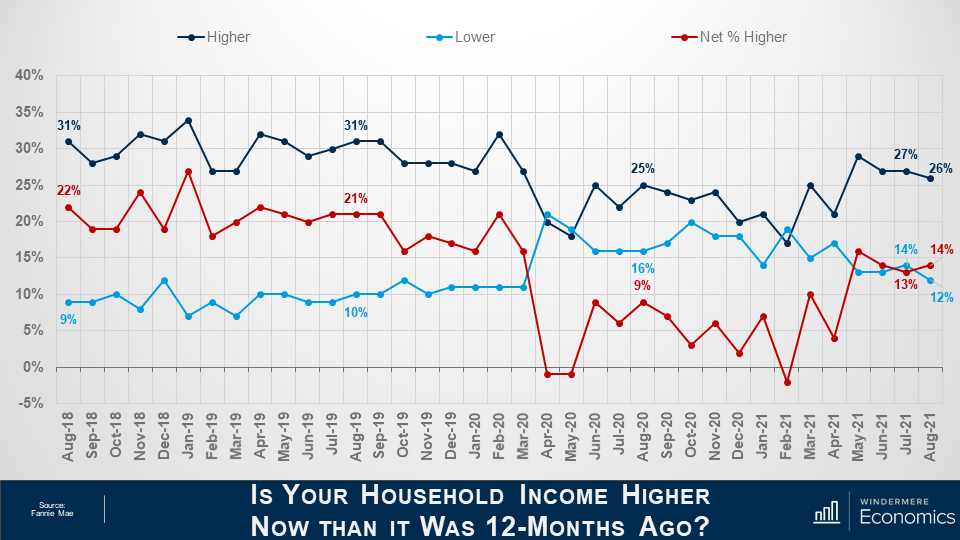
This slide is titled “Is your household income higher now than it was 12-months ago?” the graph has 3 lines on it comparing different responses from the survey. The x-axis goes from -5% to 40% and the y-axis shows the dates from August 2018 to August 2021. The navy line indicates respondents who reported a higher income, the light blue indicates those with lower income and the red line shoes the net percentage who have higher income. The navy line is mostly the largest portion staying on the top of the graph, but it dips below the light blue line in April 2020, May 2020, and February 2021. The red line say a 1% increase in the last month, but rose from 9% in August 2020 to 14% in August 2021.


And finally, when households were asked about their own personal finances, the percentage of respondents who said that their household income is significantly higher now than it was 12 months ago pulled back one point to 26%, while the percentage who said that their household income is significantly lower dropped to 12%.

As a result, the net share of those who said that their household income is significantly higher than it was a year ago rose by 1 percent month over month and came in 5 points higher than a year ago. It’s also worthwhile noting that most said that their household income is about the same as it was a year ago with that share rising from 56 all the way up to 59%.


Looking at all the numbers in aggregate, the index level was relatively flat in August with three of the index’s six components rising month over month, while the other three fell, and that tells me that the continued strength of demand for housing and definitely favorable conditions for home sellers may well be offsetting broader concerns about the Delta variant of COVID-19 as well as rising inflation that have both negatively impacted other consumer confidence indices.

Most consumers continued to report that it’s a good time to sell a home – but a bad time to buy – and they most frequently cite high home prices and a lack of supply as their primary rationale.


However, the ‘good time to buy’ component, while still near a survey low, did tick up for the first time since March, perhaps owing in part to the very favorable mortgage rate environment as well as growing expectations that home price appreciation will begin to moderate over the next year. A sentiment that I personally agree with.

Well, I hope that you have found this month’s discussion to be interesting. As always if you have any questions or comments about this topic, please do reach out to me but, in the meantime, stay safe out there and I look forward the visiting with you all again, next month.

Design September 26, 2021

How to Choose the Best Flooring

Flooring is a key component of a home’s design and can often be the centerpiece of a renovation or remodel. Because it covers such a large surface area it will significantly impact the look and feel of your home, so choosing the right material can be stressful. Weigh your options before making a decision. Learn about the different types of material, assess your budget, and form a plan for installation.

How to Choose the Best Flooring

Room Function

How you spend time in any given room will help you decide which type of flooring is best. In your home office, choose the flooring that best accommodates your working needs. Carpet can be comforting while hardwood and laminate are more durable. Entryways, mudrooms, playrooms, and pet rooms will undoubtedly see their fair share of dents, cracks, and dings, so a resilient material is best for these areas. Consider materials that are strong and easy to clean, such as tile. The kitchen is a high-traffic area that is constantly being cleaned and re-cleaned. Explore solid yet easy to clean materials like vinyl, hardwood, and ceramic tile. If these common flooring materials aren’t to your liking, certain alternative flooring options may appeal to you, including bamboo, cork, and concrete.

Budget

Your budget will be a major deciding factor in which type of flooring you ultimately install. Are you replacing your flooring as part of a larger, full-scale remodel? If so, there may be other projects that will warrant a larger share of your budget. Are you looking to make the flooring a selling point of the home? If so, you’ll likely dedicate more money towards the material and installation. Talk to your agent about which types of flooring have the best resale value and what buyers in the area are looking for. For example, if you live in a climate that experiences cold temperatures, heated flooring may give your home a competitive advantage over other listings when it comes time to sell.

Installation

There are two approaches to a flooring installation: DIY or professional. Installing your flooring on your own is a great way to save money on the project, but it’s also a lot of added responsibility. Before making the decision to install on your own, understand the risks involved with the project and the time it will take to complete it. Vinyl and laminate flooring tend to be easier to install DIY. Hiring a professional will come with increased costs, but you’ll be paying for higher quality work that will increase the value of your home. More involved flooring installations such as hardwood are usually best handled by a pro.

Style & Color

After your budget has been set and you’ve decided on how to install, then comes the fun part. When choosing the style of your flooring, think about how it will interact with the space. Will the flooring be the focal point of the space? Will it compliment the features of the room and the surrounding décor? Knowing these answers will help to sort out the fine details, such as the specific shade of tile or the grain of wood.

Maintenance

At the end of the day, you may simply be looking for flooring that’s easy to take care of. In that case, explore common low-maintenance materials like vinyl and laminate. Vinyl flooring—whether it’s tile, sheet, plank, or peel-and-stick—requires little care compared to high-maintenance flooring such as solid or engineered wood.

Market NewsMarket ReportMatthew Gardner September 16, 2021

Q2 2021 Western Washington Real Estate Market Update

The following analysis of the Western Washington real estate market is provided by Windermere Real Estate Chief Economist Matthew Gardner. We hope that this information may assist you with making better-informed real estate decisions. For further information about the housing market in your area, please don’t hesitate to contact your Windermere Real Estate agent.


REGIONAL ECONOMIC OVERVIEW

Employment levels in Western Washington picked up in the late spring and early summer months. The region has now recovered 168,800 of the 297,210 jobs that were lost due to the pandemic. Although the recovery is palpable, there are still 128,000 fewer jobs than there were at the pre-COVID peak in February 2020. The most recent data (May) shows the region’s unemployment rate at a respectable 5.2%. This is significantly lower than the April 2020 high of 16.8%, but still not close to the 2020 low of 3.7%. The jobless rate was lowest in King County (4.8%) and highest in Grays Harbor County (7.6%). Although unemployment levels continue to drop, we cannot attribute all the improvement to job creation: a shrinking labor force also lowers the jobless rate. In short, job recovery continues but we still have a way to go.

WESTERN WASHINGTON HOME SALES

❱ Regardless of low levels of supply, sales in the second quarter rose 45.6% year-over year, with a total of 25,640 homes sold. Although comparisons to the same quarter a year ago are not informative due to the pandemic, I was pleased to see sales increase 61.3% from the first quarter of this year.

❱ Listing activity was 42.8% higher than in the first quarter, which was a pleasant surprise. Listings rose the most in Kitsap, Clallam, Island, and Mason counties, but there were solid increases across the region.

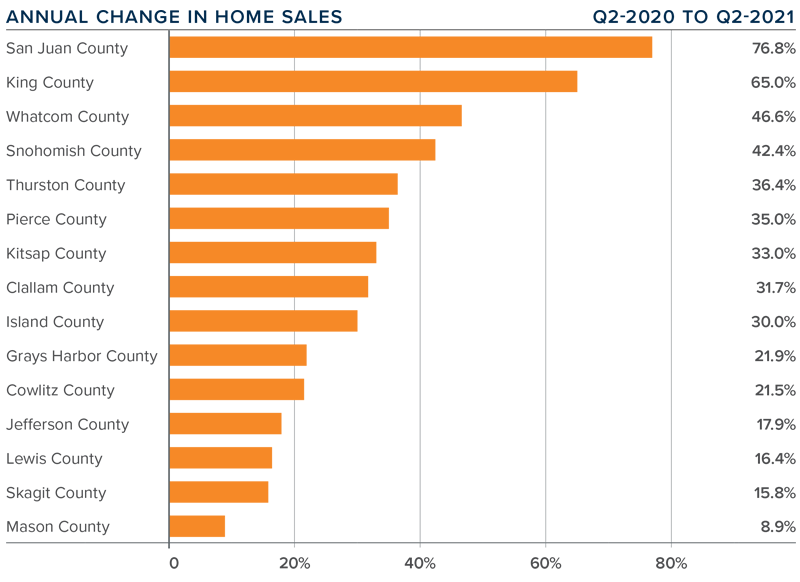
❱ Sales were up across the board, with sizable increases in San Juan, King, Whatcom, and Snohomish counties. Only Mason County experienced sales growth below 10%.

❱ Pending sales (demand) outpaced active listings (supply) by a factor of 6. Even with the increase in the number of homes for sale, the market is far from being balanced.

A bar graph showing the annual change in home sales for various counties in Western Washington.

WESTERN WASHINGTON HOME PRICES

A map showing the real estate market percentage changes in various counties in Western Washington.

❱ Home prices rose 31.4% compared to a year ago. The average sale price was $734,567—another all-time record.

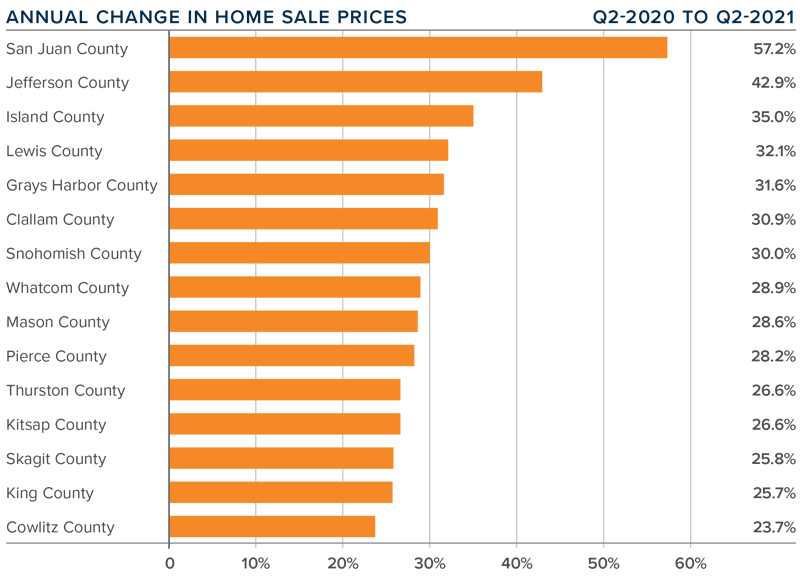
❱ Year-over-year price growth was strongest in San Juan and Jefferson counties, but all markets saw prices rise more than 23% from a year ago.

❱ Home prices were a remarkable 15.7% higher than in the first quarter of this year, possibly due in part to the drop in 30-year fixed mortgage rates between the end of the first and second quarters. That said, the modest decline in mortgage rates is certainly not the primary driver of price growth; the culprit remains inadequate supply.

❱ Relative to the first quarter of the year, San Juan (+33%), Jefferson (+24.7%), and Island (+20.5%) counties saw the fastest rate of home-price appreciation.

A bar graph showing the annual change in home sale prices for various counties in Western Washington.

DAYS ON MARKET

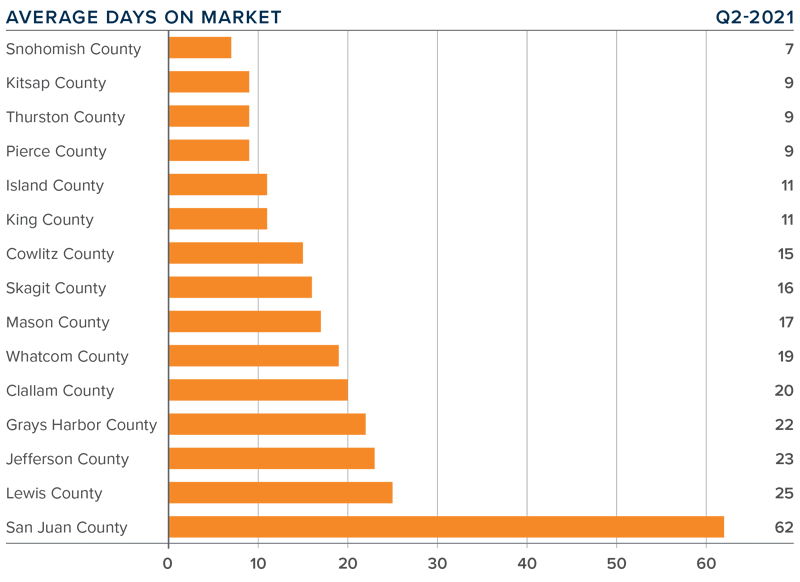
❱ It took an average of only 18 days for a listed home to go pending. This was 22 fewer days than a year ago, and 11 fewer days than in the first quarter of 2021.

❱ Snohomish, Kitsap, Thurston, and Pierce counties were the tightest markets in Western Washington, with homes taking an average of only 7 days to sell in Snohomish County and 9 days in the other three counties. The greatest drop in market time compared to a year ago was in San Juan County, where it took 84 fewer days to sell a home.

❱ All counties contained in this report saw the average time on market drop from the same period a year ago. The same can be said when comparing market time in the current quarter with the first quarter.

❱ It’s widely known that the area’s housing market is very tight and unfortunately, I don’t expect the number of listings to increase enough to satisfy demand in the near term. Furthermore, I’m seeing rapid growth in demand in the counties surrounding King County which is likely proof that buyers are willing to move further out given the work-from-home paradigm shift.

A bar graph showing the average days on market for homes in various counties in Western Washington.

CONCLUSIONS

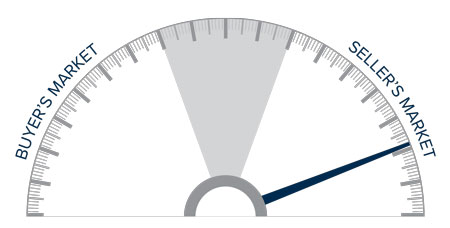
A speedometer graph indicating a seller's market in Western Washington.

This speedometer reflects the state of the region’s real estate market using housing inventory, price gains, home sales, interest rates, and larger economic factors.

Demand is maintaining its momentum, and, even with supply levels modestly improving, the market remains extraordinarily tight.

Mortgage rates are still hovering around 3%, but the specter of them starting to rise at some point is clearly motivating buyers. I am very interested to see significant interest outside of the Seattle metro area, although King County is certainly still performing well. I will be monitoring whether this “move to the ‘burbs” is endemic, or a temporary phenomenon. My gut tells me that it is the former.

At some point, the remarkable run up in home values will slow. Affordability constraints are becoming more widespread, and even a modest uptick in mortgage rates will start to slow down price increases. It’s worth noting that list-price growth is starting to taper in some markets. This is a leading indicator that may point to a market that is starting to lose a little momentum.

The bottom line is that the market still heavily favors sellers and, as such, I am moving the needle even more in their favor.

ABOUT MATTHEW GARDNER

Matthew Gardner - Chief Economist for Windermere Real Estate

As Chief Economist for Windermere Real Estate, Matthew Gardner is responsible for analyzing and interpreting economic data and its impact on the real estate market on both a local and national level. Matthew has over 30 years of professional experience both in the U.S. and U.K.

In addition to his day-to-day responsibilities, Matthew sits on the Washington State Governors Council of Economic Advisors; chairs the Board of Trustees at the Washington Center for Real Estate Research at the University of Washington; and is an Advisory Board Member at the Runstad Center for Real Estate Studies at the University of Washington where he also lectures in real estate economics.

Seller September 13, 2021

5 Green Upgrades that Increase Your Home Value

Selling a home begins with understanding how much it’s worth. After an initial assessment, you may want to make some updates to increase the value of your property. There are several ways to do that, including boosting your curb appeal or making renovations with significant ROI potential. As you research potential projects, keep in mind that making your home more sustainable can boost its value to potential buyers. Talk with your agent to identify which of these five upgrades makes sense for your home before it hits the market.

Five Green Upgrades that Increase Your Home Value

1. Energy-Efficient Appliances

It’s no secret that appliances use a significant amount of energy, which means there is plenty of opportunity to cut back on their output. Installing energy-efficient appliances can do wonders for creating a more eco-friendly home, while appealing to buyers who value sustainability. When shopping around, look for appliances with high-efficiency or Energy Star certifications. They may cost more to purchase, but their ability to generate long-term savings is a concrete selling point.

2. Tankless Water Heater

As the shift toward eco-friendly appliances has picked up steamed, so too has the preference for tankless water heaters. Whereas standard storage tank water heaters keep a reservoir of hot water at the ready, tankless water heaters heat your home’s water supply on-demand. It’s similar to a new car that shuts off its engine when sitting idle, as opposed to an older car whose engine is running all the time. Tankless water heaters don’t come without their share of costs. An upfront investment will be required for purchase and installation, but it will deliver immediate savings on energy bills.

3. Solar Panels

There are many benefits to going solar, but for sellers, the positive effect solar energy has on home values is chief among them. A solar-capable home is a surefire way to drum up buyer interest. By taking care of the upfront installation costs, you allow the buyer to focus on the benefits of solar energy, i.e. the long-term energy savings, the reduced utility bills, and the reduction in the property’s carbon footprint. Work closely with your real estate agent to understand how solar energy has affected home prices in your area to get an idea of the project’s ROI potential.


A man installs solar panels on the roof of a house.

Image Source: Getty Images


4. Water Filtration

Installing a home water filtration system is one of the best ways to cut down on your home’s waste while increasing its value. These filtration systems appeal to buyers for a variety of reasons. Of course, there are an array of health benefits to having filtered water running through the entire house. Buyers can be assured that the water is safe to drink, they will be bathing and showering in clean water, and there is a reduced risk of plumbing issues due to contaminated water. Beyond the personal health benefits, it can also cut down on bottled water costs and the amount of landfill waste produced within the home.

5. Energy-Efficient Windows

Alternatives to traditional windows have become more popular in recent years. Energy-efficient windows are better insulated, which helps to regulate temperatures inside the home and protects against harmful ultraviolet rays. Their ability to help regulate your home’s heating and cooling leads to energy savings and reduced carbon emissions. Energy-saving windows can be highly valuable to potential buyers, especially if you live in a climate with extreme temperatures.

Market NewsMatthew Gardner June 9, 2021

Matthew Gardner: What You Should Know About Today’s Real Estate Market

by Matthew Gardner

Understanding the housing market is a matter of analyzing its many data sets. In a recent piece for Inman News, Windermere Chief Economist Matthew Gardner offered his perspective on recent U.S. pending sales, new-home sales, and existing-home sales figures.

If you’re involved in the housing market, and I assume that most of you are, you know very well that this is a numbers business. All of us are surrounded by housing-related data day in and day out, and it can become a little overwhelming at times — even for an economist like myself.

Well, today I’d like to take a few minutes to talk about just a couple of the datasets that I think are particularly important to track and offer you my perspectives on them.

Housing

There’s no doubt that the ownership housing market really was a beacon of light as we moved through the pandemic period. Even though the market paused last spring as COVID-19 hit the nation, it snapped back remarkably quickly, unlike many other parts of the U.S. economy that are still suffering today.

This is important, as housing is a significant contributor to the broader economy. For example, last year, spending on the construction of new homes, residential remodeling and real estate brokers fees amounted to around $885 billion or 4.2 percent of gross domestic product.

But the real number is far greater than that when you add in all spending on all household services. The total amount of money spent on housing in aggregate was around $3.7 trillion or 17.5 percent of the country’s economy.

So, we know that the housing market is a very important part of our economy, but can that number continue to grow? Let’s take a look.

Inventory

The chart below shows the number of single-family homes for sale going back to 1983. As you can clearly see, there’s never been a time — at least since records were kept at the national level — where they were fewer homes for sale at any one time.

Line graph titled “inventory of homes for sale” along the x axis are the Months starting with January 1983 and ending with August 2020. On the y axis is 0 through 4. The line shows that in August 2020 there are fewer homes on the market than ever before. Source is NAR with Windermere Economics seasonal adjustments.

And this is a problem because the biggest issue the market faces today is that demand for homes is far exceeding supply.

A report I track very carefully — and I am sure that many of you do, too — is the National Association of Realtors pending home sales index, which is shown below.

Although it’s not a perfect indicator, as the survey only covers about 20 percent of all homes that go pending, it does give us a pretty good idea as to what the future may hold given that, all things being equal, about 80 percent of pending homes close within roughly two months, making it a leading indicator.

Line graph titled “Pending Home Sales Index” that shows the 12-month percentage change, seasonally adjusted. Along the x axis are months from January 2019 to March 2021. On the y axis is percentages from -40% to +30% with a line through the graph marking 0%. The line shows a significant decreased in April 2020 from 10% in February 2020 to -35% in April 2020, then a quick recover peaking around 25% in August 2020. Source NAR.

You can clearly see the massive pull back last spring because of the pandemic, but this was very quickly followed by a very significant surge.

It pulled back again last winter, but I would suggest that this was more a function of lack of homes for sale than anything else. However, look at the March spike.

Now, you might be thinking that this is a great number, but I would caution all of you not to pay too much attention to year-over-year changes, as they can be deceiving. You see, the index jumped because it was being compared with last March when the pandemic really started.

Closed sales

When we look at closed sales activity, it actually lines up pretty well with the pending home sales index, which fell in January and February. This is reflected in the contraction in closed sales that we saw this spring. And if the index is accurate, it suggests we may see closed sales activity pick up again over the next couple of months.

Line graph titled “Existing Home Sales” in millions seasonally adjusted. Along the x axis is months from January 2021 and April 2021. On the Y axis is numbers between 3.0 and 7.0, increasing by half points. The line shows a sharp decrease in April 2020 and a quick recover with a peak at 6.7 in October 2020. Source is NAR.

Of course, any time where housing demand exceeds supply, there is a solution — and that would be to build more homes.

But as you can see here, though more homes started to be built as we emerged from the financial crisis, the number today is essentially the same as it was two decades ago and has been declining for the past two years.

Two line graphs next to each other, the slide is titled “New Homes for Sale” on the left is Single Family New Homes for Sale in the US in thousands, seasonally adjusted. Along the x axis is years from 2000 to 2020 and on the y axis is numbers from 0 to 700 in increments of 100. This graph shows a peak between 2006 and 2008 just under 600, with a sharp decline after that, the lowest point in 2021. With some recover, the line peaks again in 2020 just above 300. On the right is New Homes for Sale by Stage of Construction. The light blue line is not-started, the green line is completed, and the navy blue line is under construction. Not-started is consistently the lowest number between 2000 and 2018, but in 2019 it rises above the green line. The navy blue line is consistently on the top of the graph, which a small dip that goes below the green line in 2009. Source: Census Bureau.

That’s significant, as the country has added over 12 million new households during the same period which has further fueled demand for housing. If there are no new homes to buy, well, that does one thing — and that’s to put more focus on the resale market, which has already led to very significant price increases.

New home market

But this particular report also offers some additional data sets, which I think give more clarity to the state of the new home market.

Before the housing market crashed, you can see that a majority of new homes that were on the market for sale were being built at that time, but — as the housing bubble was bursting — the market dropped, and the share of homes that were finished and for sale naturally rose.

But what I want you to look at is the far right of the chart above. You see the spike in the share of homes for sale that have not yet been started?

Well, given the massive increase in construction costs builders have, understandably, become far more cautious and are trying to sell more homes before they start to build them to mitigate some of the risk. It also tells me that they see demand that is not being met by the existing-home market and are looking to take it advantage of this.

When we look at new home sales, you can see that the trend, in essence, follows the number of homes for sale, but I would caution you on a couple of things.

Two graphs side by side, the slide is titled “New Home Sales” on the left is a line graph of us single family new home sales in thousands. On the x axis is dates from 2006 to 2020 and on the y axis is numbers from 0 to 1,600 in increments of 200. The line shows the peak in 2006 at 1,400 with a sharp decline afterwards until it bottoms out in 2010 at around 200. From there there’s a slow recover, with a peak in 2021 at around 1,000. On the right is a clustered column graph titled New Homes Sold by Stage of Construction. The green bars represent not started, the light blue columns represent under construction, and orange shows the completed projects. On the x axis is months from January 2020 to April 2021 and on the y axis I percentages from 20% to 45% in 5% increments. From Jan 2020 to July 2020 the orange bars representing completed are the highest bars, but from August 2020 to March 2021, the blue bars are the highest showing that homes under construction were the most common new homes purchased. Source: Census Bureau.

Firstly, these figures do not represent closed sales, as the Census Bureau, which prepares this dataset, considers a home sold once it has gone under contract. This makes sense, as a home can be sold before it has even broken ground. In essence, it’s more similar to NAR’s Pending Home Sales Index than anything else.

Look now at sales by stage of construction on the right. You can see that, as the pandemic was getting started, new homes that were ready to move into were what buyers wanted, and that accounted for over 42 percent of total new sales in April.

As the supply of finished homes dropped, homes that were being built took the lion’s share of sales — as they have done historically. However, look at April. The greatest share of sales — 37.7 percent — were homes that hadn’t yet been started.

Again, this supports the theory that builders remain cautious given ever-escalating costs, but it also shows that buyers’ needs are not being met by the resale market, so they were willing to wait, likely a considerable time, for their new home to be built.

Of course, the couple of datasets I’ve shared with you today are just the tip of the iceberg when it comes to the housing-related numbers you should all be tracking, as they can tell a story that can impact everyone involved in the development or sale of homes.

Mortgage rates

In addition to the data we have discussed today, you should be well versed in mortgage rate trends, demographic shifts, building permit activity and the economy in general — and you need to understand all these numbers at a local as well as national level.

For the vast majority of households, buying a home will be the most expensive thing that they will ever purchase in their lives. And given memories of the housing crash, as well as the significant increase in home prices that we’ve seen since last summer, it’s now more important than ever for you to be able to share your knowledge with your clients and be able to advise them accordingly.


Windermere’s Chief Economist, Matthew Gardner, often contributes to local and national publications with his insights to the housing market. Recently he offered his analysis of home sales numbers to Inman News, this is a repost of that video and article

For more market news and updates from Matthew Gardner,

visit our Market Update page.

Living March 24, 2021

How to Prevent Water Damage to Your Home

Water is constantly coursing through your home, flowing in and out of drain pipes, sinks, tubs, and showers. Numerous systems in our homes are dependent upon water, but the minute it runs rampant it begins to cause damage. The consequences of water damage run the gamut, from rotted drywall and mold growth to serious structural issues. The following guide will help you understand what you can do to prevent water damage in your home.


How to Prevent Water Damage

Leaks

Leaks soften wood, which invites all sorts of unwanted activity from termites, while simultaneously creating a perfect habitat for mold and mildew growth. To prevent leaks, keep your drains healthy by frequently cleaning out your drain strainers and refraining from dumping grease down your drains. Check to make sure none of your drains are leaking and if need be, repair or replace your p-traps. Drips, dark stains around your pipes, and discoloration on your ceilings and walls are all strong indicators that a leak has sprung. If you notice an inexplicable spike in your water bill, this is also a sign of a potential leak. By identifying these signs, you can begin repairs right away and stop the water damage in its tracks.

Gutter drainage

A home with weak gutter drainage is an open invitation for water damage to occur. Cleaning your gutters routinely is the best way to prevent them from clogging, which helps to avoid damage to your siding and foundation. Make sure your downspouts expel the gutter water away from your house parallel to the ground. Take a trip to the hardware store for downspout extensions and elbows to make sure that water won’t build up around your home’s foundation, especially if you live in a rainy climate.

Sump pump

Your sump pump can be your saving grace should a water emergency occur. Sump pumps move excess groundwater away from your home, preventing it from infiltrating your basement or crawl space. They are connected to the Ground Fault Circuit Interrupter (GFCI) electrical outlet, which protects it from electrical shorts. There are two ways to test your sump pump. The first is by pouring in enough water to raise the float. If it’s working properly, the pump should activate and begin removing water from its pit. The other method is to unplug the pump’s power and plug it back in. If it does not turn on, it requires repair or replacement.

More

There are some additional steps you can take to prevent water damage to your home. Inspect your roof to identify any damaged shingles or cracks. While you’re up on the roof, take a look at your chimney. Repair any cracked or broken bricks and consider a chimney cap if you don’t already have one in place.


Water damage can be harmful to your home and your finances. Even the smallest leak can snowball into larger problems if neglected. By following the steps to prevent water damage, you’ll know if your home needs repairs before it’s too late. For more advice on preventing damage to your home, read our guides to wildfire and winter storm prevention.

Buyer March 24, 2021

Working with a Buyer’s Agent

What is a Buyer’s Agent?


A typical real estate transaction involves a buyer’s agent representing the buyer and a listing agent representing the seller. A buyer’s agent helps the buyer identify potential homes to pursue, advises them on negotiations, and helps navigate any hurdles during the buying process. Once they are under contract, the buyer’s agent will work to close the sale, monitoring all the key dates and deadlines along the way. Once the transaction is complete, buyer’s agents split the commission of the sale with the listing agent.


Advantages of Working with a Buyer’s Agent

Find the right home

A buyer’s agent not only possess expert knowledge of local market conditions, but they also have access to tools that will help their clients see the widest array of available homes, and eventually, find the right home. By exploring the Multiple Listing Service (MLS), they can access the vastest network of available listings, and receive up-to-date alerts on open houses. They are usually the first to know when a home hits the market and are sometimes aware of homes that are scheduled to list in the near term.  Buyer’s agents can advise their clients on how a home’s outstanding repairs and improvements could affect their decision to purchase, whether the home is in need of an inspection, and discuss the necessity of a home warranty.


Save time

Buying a home takes time, but a buyer’s agent will help streamline the buying process. This includes paying close attention to their client’s budget and preferences in order to focus their home search to only those listings that match their needs. Buyers can then decide which homes they would like to view in-person and their agent will contact the corresponding listing agent to set up showings. Buyer’s agents are founts of knowledge, able to provide or track down information a buyer may not be able to readily access on their own. Additionally, they are connected to a network of professionals and can produce references for mortgage brokers, real estate attorneys, inspectors, and more as needed.


Making an Offer

Once you’re ready to make an offer on a home, the importance of working with a buyer’s agent kicks into high gear. There are many different elements that impact an offer’s success, and this is where a good buyer’s agent’s specialty lies. Through their expertise, they can help their clients craft a more competitive offer and negotiate as needed. Sometimes the most competitive offers are not just about the price. Offers can win when a buyer’s agent has researched the seller’s needs and pulled together an offer that speaks to those needs. Any advantage buyers can gain to make their offer stand out will strengthen their case. This is especially important in competitive markets when multiple competing offers are on the table.

Throughout the process of making an offer on a home, a buyer’s agent is there to answer any questions that may arise and pore over the details so that nothing goes unnoticed. This is critical since sellers will likely toss aside any offers that come in with missing documents, errors in the contract, and other inconsistencies. When buying a home, buyers often fear that they will miss something during the buying process, that they are going to pay too much, that there will be something wrong with the house after they buy it, or that they’ll lose the home to another buyer. Buyer’s agents help to alleviate these stresses and make sure the buying process runs smoothly.


When determining which agent to work with, it’s important to ask questions to gain an understanding of their expertise, see their personality, and get a gauge of how well they understand what you’re looking for in a home. If you would like some help connecting with an agent, you can get started here: Connect with An Agent

Living March 22, 2021

Timeless Home Design

When decorating and designing, homeowners often strive for a home that may incorporate vintage and modern elements but remains timeless at its core. Fortunately, certain design principles and elements have stood the test the time and can help you curate the home you desire. Here is your guide to understanding how you can design a home that looks and feels timeless.


Principles of Timeless Home Design

Balance

When designing a space in your home, balance is a key concept to delivering a timeless ambiance. Achieved through a proportionate arrangement of objects and colors, balance will help create a logical pattern in your home that pleases the eye. Experiment with symmetry in your home to build balance. This doesn’t mean that there needs to be two of every object, rather in every space you should utilize the objects and color schemes present to create symmetry.


Focal Point

Imagine a living room without a couch or mantle, or a dining room without a dining table. These images are confusing because we simply don’t know where to focus our attention. A core principle of timeless design is that space should have a focal point to give order to the room. Focal points don’t always have to be derived from a built-in feature of the home, you can create one with furniture, artwork, or some other form of eye-catching décor.


Scale and Proportion

Scale and proportion are two fundamental concepts of interior design and are key to creating a timeless décor. Simply put, proportion refers to the relationship of items and colors, while scale refers to their relationship with the room. For example, if a room in your home has high ceilings, this allows for taller furniture and artwork, while the most spacious rooms in your house are the best home for large décor pieces and furnishings. Proper usage of scale and proportion also means leaving some space between items to let the room breathe, so to speak.


Colors and Patterns

For a timeless look and feel, choose more classic color and pattern schemes. Basketweave is a traditional pattern that helps to create symmetry. Stripes are always in style and can help to reinforce clean lines. Stick to neutral paint colors on your walls as they give you the flexibility to add décor without overwhelming the room. Combinations of off-whites, beiges, grays, and earthy tones will deliver that timeless feel you’re looking for.


Natural Elements

There’s nothing more timeless than nature. Materials like wood, stone, and marble have been a cornerstone of design since antiquity. Whether you utilize these materials in your home as furniture, accent pieces, or focal points, they will help create a trend-free, organic environment in any room.

Seller March 22, 2021

The Risks of FSBO

Selling a home is a complex process that requires patience, knowledge of the market, and a deep understanding of the financial processes. And that’s just the beginning. Accordingly, many homeowners trust in a professional to sell their home by working with a real estate agent. Despite the expertise an agent brings to the table, some homeowners choose to go it alone, bearing the responsibility of a successful home sale on their own shoulders. If you’re thinking about selling “For Sale by Owner”, or FSBO, know that there are certain risks and obstacles  that can easily cause your home selling journey to veer off course.


The Risks of FSBO 

Real estate agents are professionals who possess a vast knowledge of both the industry at large and local market conditions acquired through years of training, certifications, and working with clients. For FSBO sellers, the complexities of the home selling process can easily illuminate a lack of experience and leave them feeling unsure of how to continue, or worse, situations may arise where proceeding incorrectly could jeopardize the transaction. This lack of expertise could lead to incorrectly pricing your home, which will attract the wrong buyers. An accurately priced home requires market knowledge and an objective approach to the home’s value, which can be tough for homeowners. The more time an overpriced home spends on the market, the more likely the price will have to be lowered. A home with a lowered price that has been on the market for some time is less appealing to buyers than an accurately priced new listing. An underpriced home could leave significant money on the table for the seller.


A common motivating factor for wanting to sell FSBO is that, in the case of a successful sale, the seller avoids paying commission to an agent. However, what that commission ultimately pays for is a vast skill set that is specifically trained to get you the most money for your home. Agents not only have access to all kinds of information on local market conditions, trends in the real estate market, and data on comparable homes in your area, they are also connected to a network of potential buyers and have the marketing know-how for appealing to them and any others in your market. To attempt to approach this same level of visibility while selling FSBO means incurring additional expenses like ad placement, signage, hiring a photographer, and more.


Selling a home takes up a great deal of time. FSBO sellers can expect to stage the home, host showings and tours, answer phone calls from buyers, interview home inspectors, and coordinate open houses, all while gathering data on the local market—and that’s all before any negotiations or paperwork. When an offer comes through, FSBO sellers must dive into the extensive documentation required for the mortgage, title transfer, and any other legalese involved in the transaction. It’s like having another job that you may simply not have time for, whereas a real estate agent’s job is to dedicate their time, energy, and experience to the successful sale of your home.


All these factors make selling FSBO a risky proposition. Mistakes in the selling process can lead to both financial and legal implications, but part of a real estate agent’s expertise is knowing how and when these dangers can arise and navigating them properly. If you’re looking to sell your home, we’re happy to connect you with an agent here: Connect With an Agent